 Rimani

Condizioni di trading
Strumenti


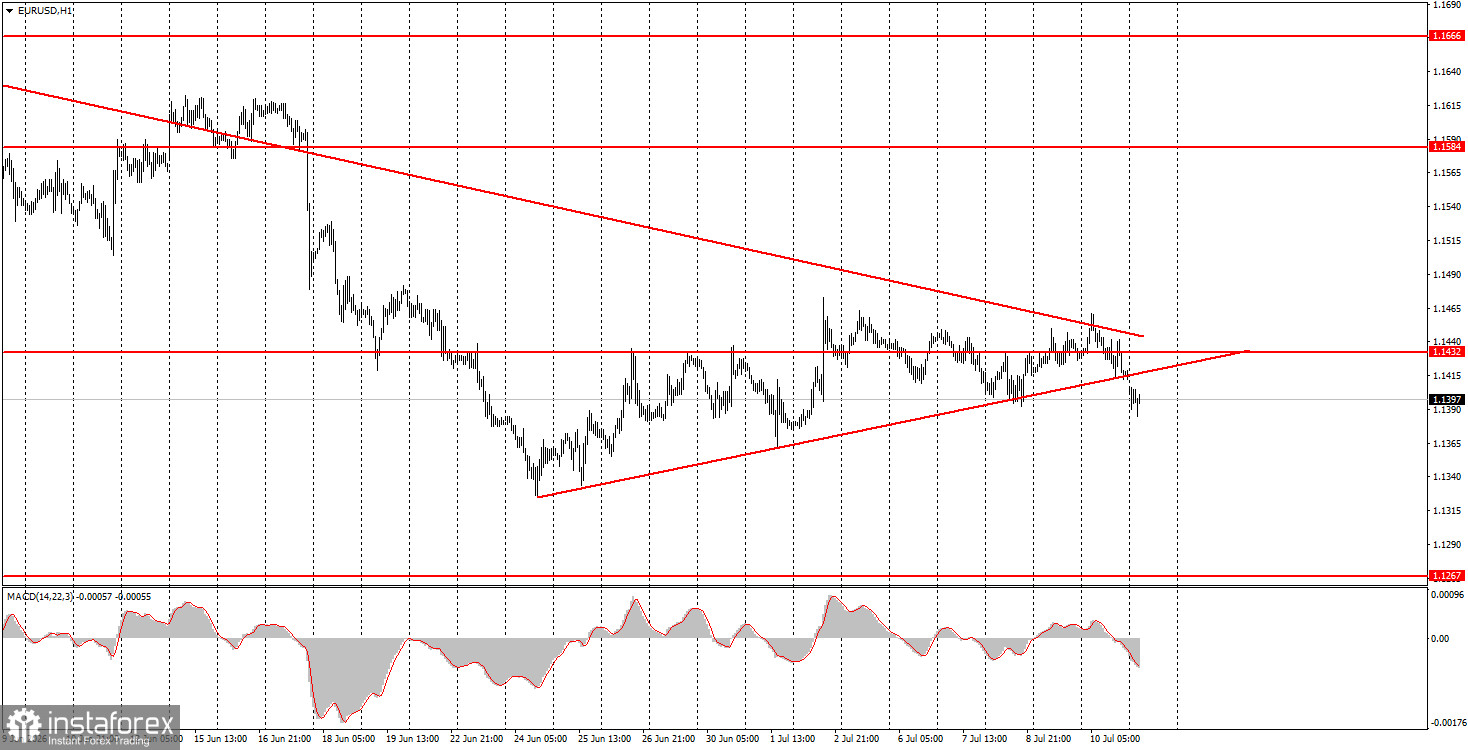
The EUR/USD currency pair broke through the ascending trend line during Friday's trading, while the descending trend line remained relevant. Thus, the pair is much closer to a new decline than to a resumption of growth. It is worth noting that the European currency has been rising for over two weeks, but over this period it rose by only 130 pips. Regardless of the geopolitical, fundamental, and macroeconomic backdrop, market sentiment remains "bearish." On Friday, there were no significant events in Germany, the UK, the US, or the European Union. Therefore, there was nothing for traders to react to throughout the day. On Saturday, it became known that the Middle East could "flare up" again, with Iran once again attacking vessels in the Strait of Hormuz and launching strikes on American military bases in Bahrain and Kuwait. However, such developments no longer surprise anyone. Nothing has changed following the signing of the memorandum of understanding between Iran and the US. On Sunday, Tehran announced the closure of the Strait of Hormuz once again.
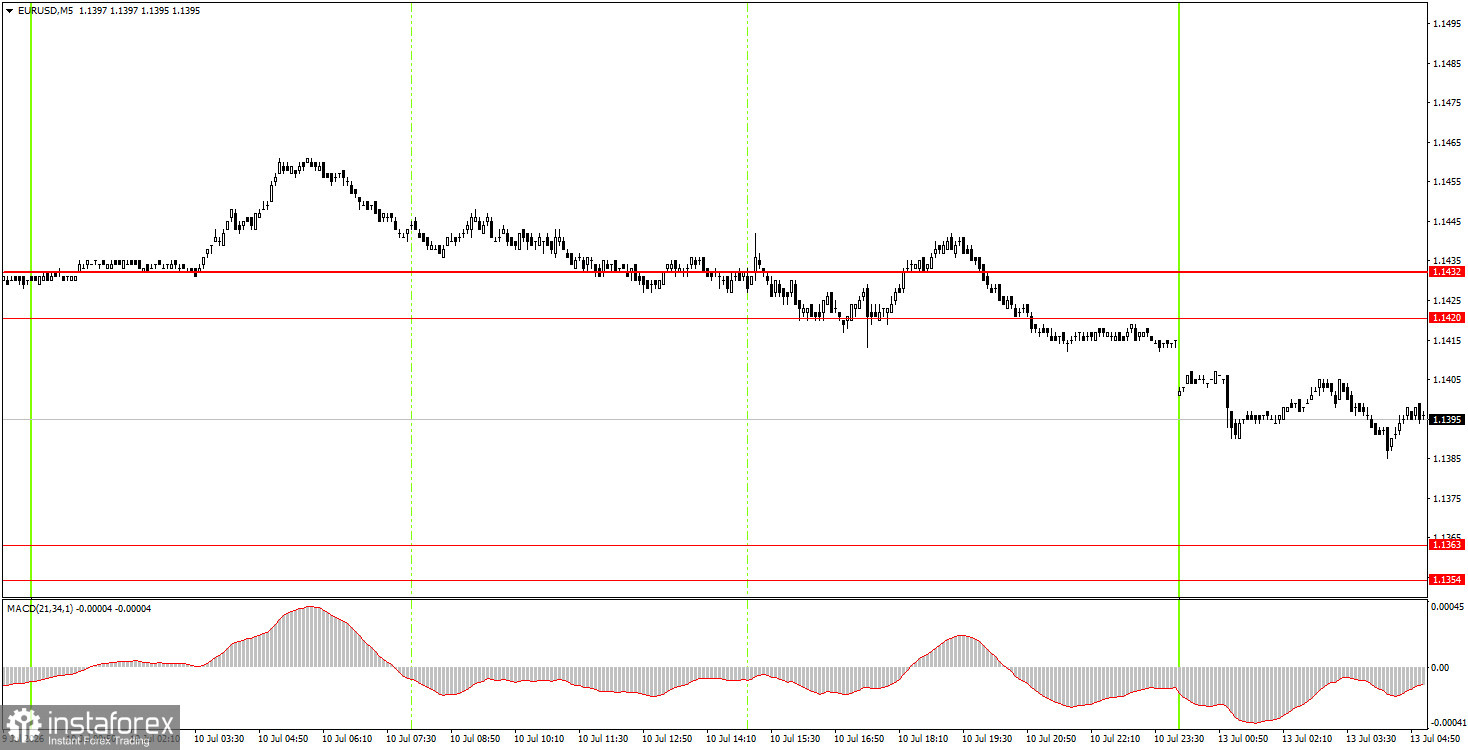
No trading signals worthy of attention were generated on the 5-minute timeframe on Friday. Only by the end of the day did the price consolidate below the support area of 1.1420-1.1432, and at the beginning of the new week, it is set to continue falling toward the target range of 1.1354-1.1363. However, during the night on Monday or at the overlap of the two weeks, it was extremely difficult to open trades. In our opinion, novice traders should wait for new trading signals.
On the hourly timeframe, a two-month downward trend persists, and over the past few weeks, we have seen only a weak upward correction. Since the upward trend line has been breached, the likelihood of a resumption of the euro's decline is high, and geopolitics may provide background support for the U.S. currency.
On Monday, novice traders can open short positions targeting 1.1354-1.1363 if the price bounces from the 1.1420-1.1432 area. Long positions can be opened with a target of 1.1420-1.1432 if the price bounces off the 1.1354-1.1363 area.
On the 5-minute timeframe, levels to consider are 1.1292, 1.1354-1.1363, 1.1420-1.1432, 1.1527-1.1531, 1.1584-1.1594, 1.1655-1.1666, 1.1745-1.1754, and 1.1830-1.1837. On Monday, no significant events or reports are scheduled in the European Union or the United States. Therefore, volatility may again be weak.
Price levels (areas) of support and resistance are targets when opening long or short positions or sources of signals.
Red lines indicate channels or trend lines that display the current trend and indicate the preferred direction for trading.
The MACD indicator (14,22,3) – histogram and signal line – is a supplementary indicator that can also be used as a source of signals.
Important speeches and reports (contained in the news calendar) can significantly impact the movement of the currency pair. Therefore, during their release, trading should be conducted with maximum caution, or one should exit the market to avoid sharp reversals against preceding movements.
Beginners trading in the forex market should remember that not every trade can be profitable. Developing a clear strategy and practicing money management are key to long-term success in trading.
Le recensioni analitiche di InstaForex ti renderanno pienamente consapevole delle tendenze del mercato! Essendo un cliente InstaForex, ti viene fornito un gran numero di servizi gratuiti per il trading efficiente.


