 Rimani

Condizioni di trading
Strumenti


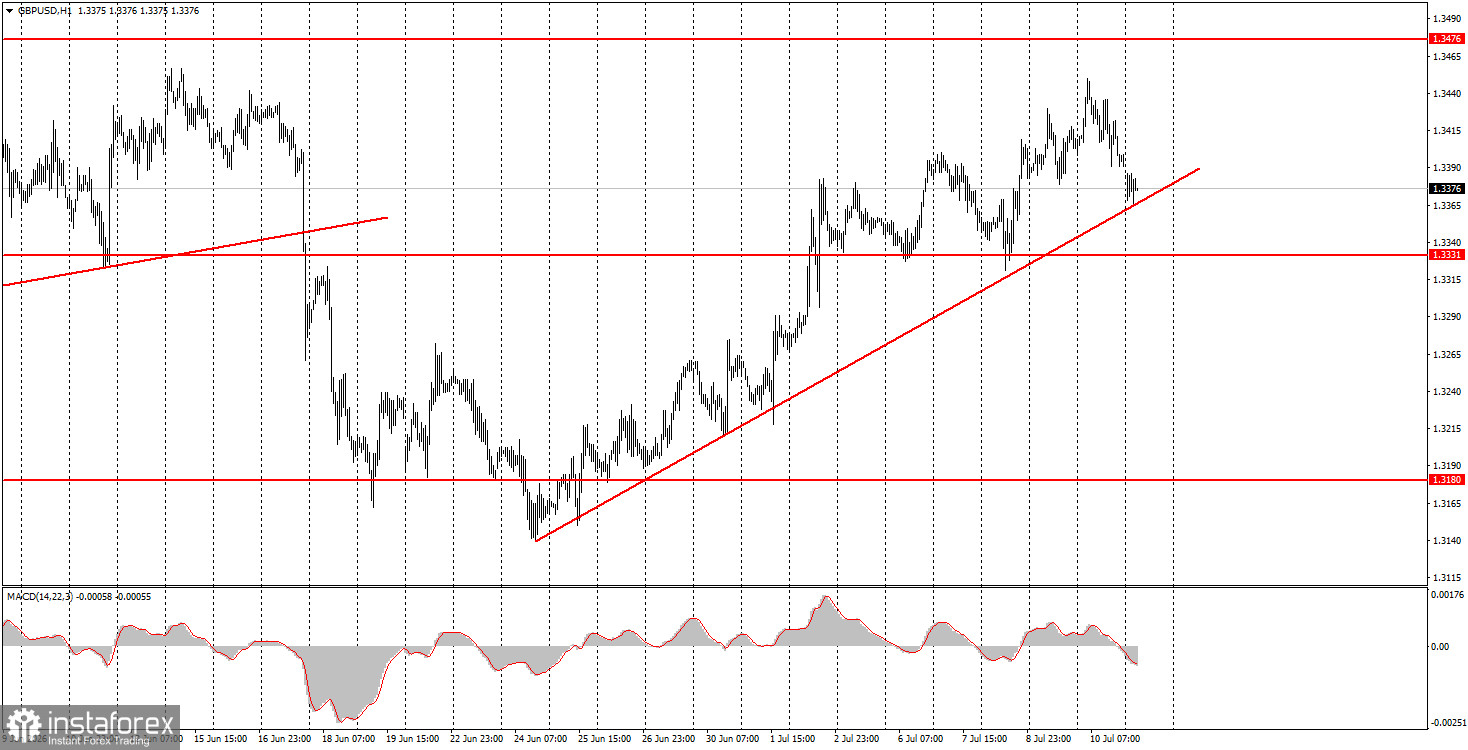
The GBP/USD pair slightly decreased on Friday but maintained an upward bias. In recent weeks, the British currency has shown confident growth without visible reasons; however, there are reasons. The last round of decline for the pair was completely illogical and baseless. Now, we have seen a recovery of the British pound to a more or less fair value in the current circumstances. The GBP/USD pair is currently near the trend line, so the market's reaction to it will determine further movement. In the event of a bounce from the trend line, a new round of growth in the British currency can be expected, one that does not require macroeconomic or fundamental support. If the trend line is breached, the British pound may continue to decline. Geopolitics in the Middle East are complicated again, but in the past two months, Iran and the U.S. have not engaged in active hostilities, only occasionally conducting strikes while negotiations continue without yielding results.
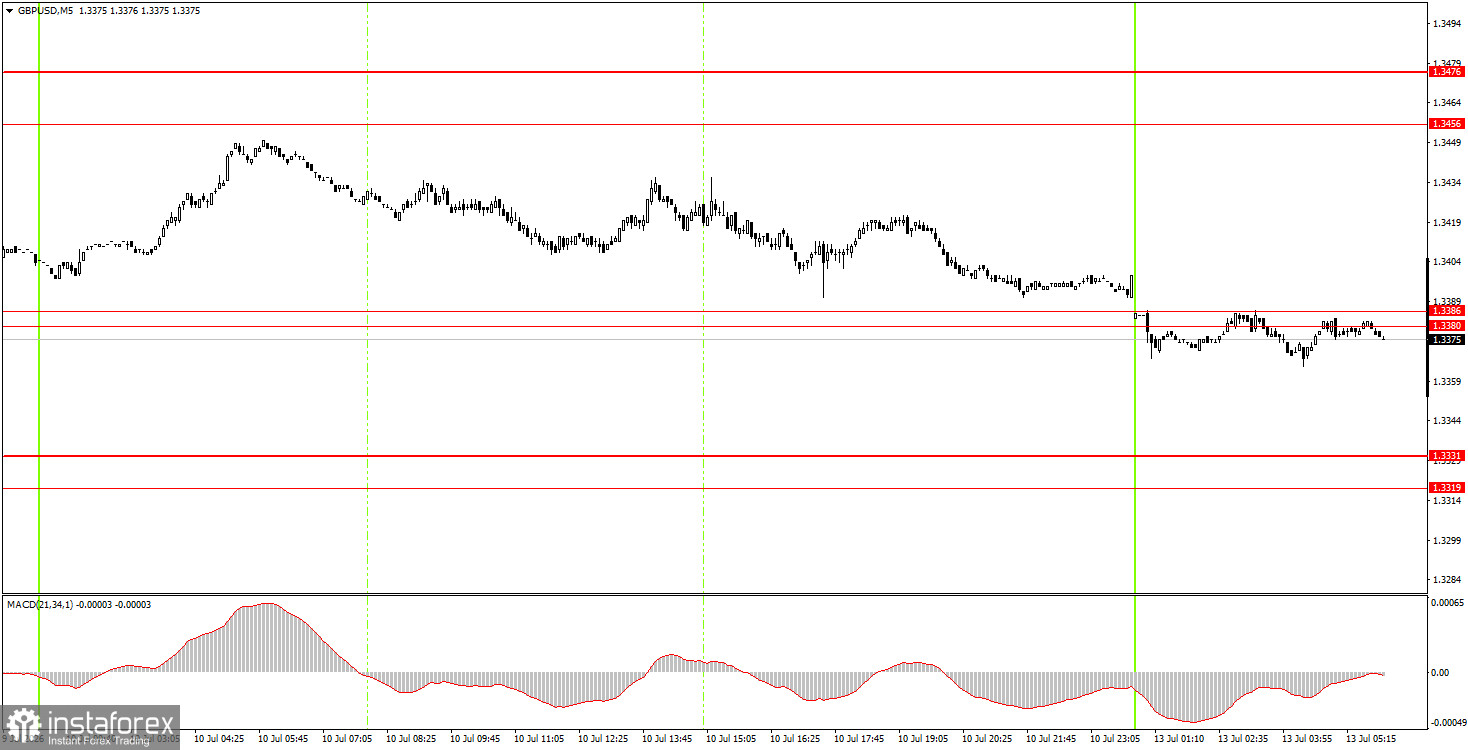
No trading signals were generated on the 5-minute timeframe on Friday. Only on Monday night did the price breach the 1.3380-1.3386 area, allowing short positions to be opened targeting 1.3319-1.3331. However, market movements today may again be extremely weak, as there are no scheduled fundamental or macroeconomic events.
On the hourly timeframe, the GBP/USD pair continues to form an upward trend that is currently corrective but could become a full-fledged trend. The conflict in the Middle East, if not entirely resolved, is on pause; the Federal Reserve has only declared a possible interest rate hike by the end of the year, which may not happen, and political crises in the UK have long ceased to be crises. We believe the dollar can only be expected to correct for now.
On Monday, novice traders may open short positions if the price consolidates below the 1.3380-1.3386 area, targeting 1.3319-1.3331. If the price consolidates above the 1.3380-1.3386 area, long positions can be opened with a target of 1.3456-1.3476.
On the 5-minute timeframe, trading levels to consider are 1.3043, 1.3096-1.3107, 1.3175-1.3180, 1.3259-1.3267, 1.3319-1.3331, 1.3380-1.3386, 1.3456-1.3476, 1.3587-1.3598, 1.3631-1.3641, and 1.3695. On Monday, no important events are scheduled in the UK or the US. Thus, movements today will again be technical and unlikely to be volatile.
Price levels (areas) of support and resistance are targets when opening long or short positions or sources of signals.
Red lines indicate channels or trend lines that display the current trend and indicate the preferred direction for trading.
The MACD indicator (14,22,3) – histogram and signal line – is a supplementary indicator that can also be used as a source of signals.
Important speeches and reports (contained in the news calendar) can significantly impact the movement of the currency pair. Therefore, during their release, trading should be conducted with maximum caution, or one should exit the market to avoid sharp reversals against preceding movements.
Beginners trading in the forex market should remember that not every trade can be profitable. Developing a clear strategy and practicing money management are key to long-term success in trading.
Le recensioni analitiche di InstaForex ti renderanno pienamente consapevole delle tendenze del mercato! Essendo un cliente InstaForex, ti viene fornito un gran numero di servizi gratuiti per il trading efficiente.


