 Rimani
Condizioni di trading
Strumenti



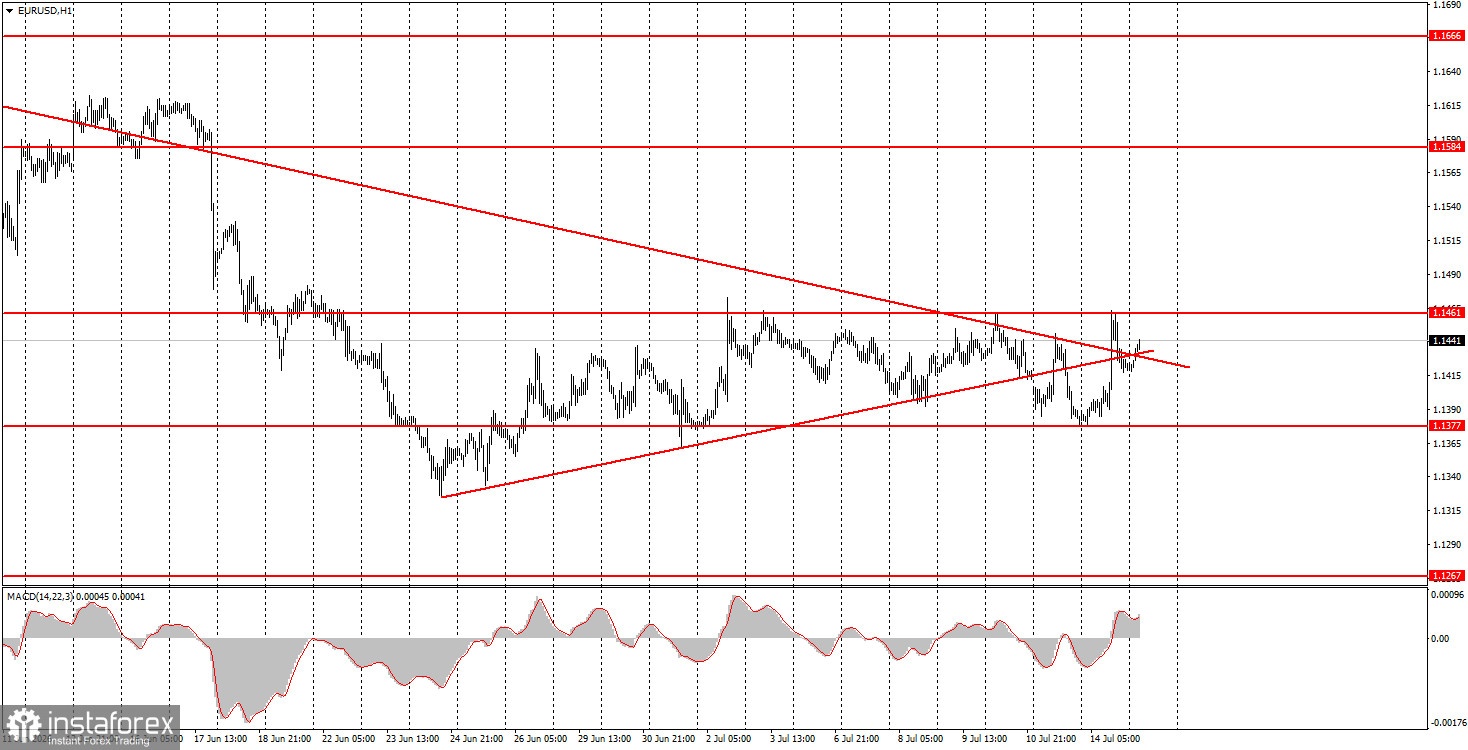
The EUR/USD currency pair remained within a sideways channel on Tuesday, confined between 1.1377 and 1.1461. The hourly timeframe illustration clearly shows that the price has been trading between these two levels for several weeks. Thus, we are dealing with a pure flat. Yesterday did not change the technical picture for the euro. Kevin Warsh's speech turned out to be remarkably bland. Essentially, the Federal Reserve Chair had nothing new to offer Congress or the market. However, this is not surprising, as Warsh advocates minimal communication with the public and will certainly not publicly promise any tightening of monetary policy. The market reacted only to the U.S. inflation report, which came in below market expectations. Despite the report's significance, the U.S. dollar maintained favorable positions. The Consumer Price Index slowed to 3.5%, raising doubts about the Fed's tightening monetary policy in the coming months. However, everything will depend on developments in the Middle East. Inflation may start rising again if the escalation continues.
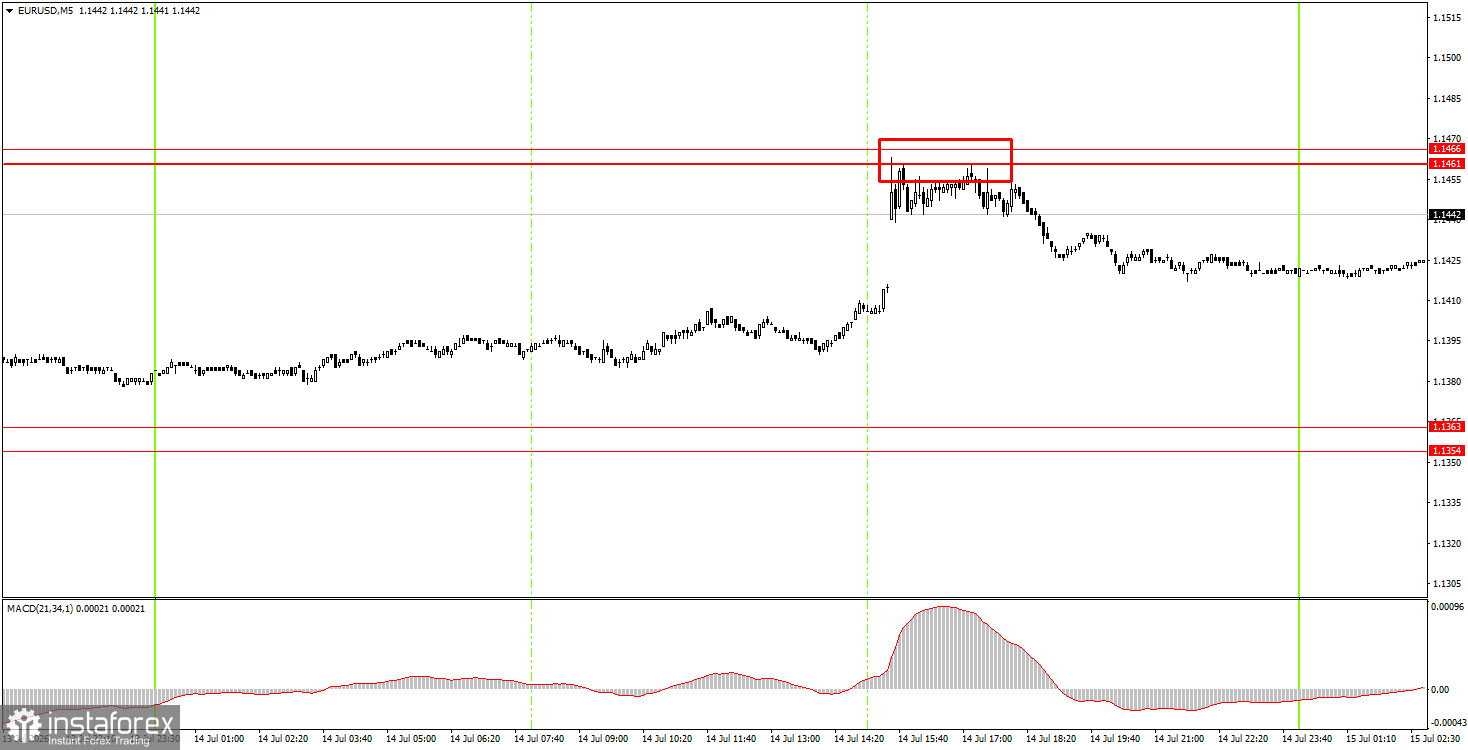
On the 5-minute timeframe, only one trading signal was generated on Tuesday. During the U.S. trading session, the price reached the 1.1461-1.1466 area and bounced back. Thus, a sell signal was formed that novice traders could have executed with a short position. Today, the pair's decline may continue toward the lower boundary of the sideways channel.
On the hourly timeframe, a two-month downward trend persists, and over the past few weeks, we have only seen a weak upward correction. Currently, both trend lines have been breached, and the market has been flat for several weeks. Geopolitics may provide background support for the U.S. dollar.
On Wednesday, novice traders can maintain the short positions opened yesterday, targeting 1.1354-1.1363, as the price bounced from the 1.1461-1.1466 area. Long positions can be initiated with a target of 1.1527-1.1531 if price consolidates above the 1.1451-1.1466 area.
On the 5-minute timeframe, consider the following levels: 1.1267-1.1275, 1.1363-1.1377, 1.1420-1.1432, 1.1527-1.1531, 1.1584-1.1594, 1.1655-1.1666, and 1.1745-1.1754. On Wednesday, an industrial production report will be published in the Eurozone, while in the U.S., the Producer Price Index will be released. Additionally, Warsh will give his second speech in Congress. We consider all three events secondary and do not expect any strong market reaction to them.
Price levels (areas) of support and resistance are targets when opening long or short positions or sources of signals.
Red lines indicate channels or trend lines that display the current trend and indicate the preferred direction for trading.
The MACD indicator (14,22,3) – histogram and signal line – is a supplementary indicator that can also be used as a source of signals.
Important speeches and reports (contained in the news calendar) can significantly impact the movement of the currency pair. Therefore, during their release, trading should be conducted with maximum caution, or one should exit the market to avoid sharp reversals against preceding movements.
Beginners trading in the forex market should remember that not every trade can be profitable. Developing a clear strategy and practicing money management are key to long-term success in trading.
Le recensioni analitiche di InstaForex ti renderanno pienamente consapevole delle tendenze del mercato! Essendo un cliente InstaForex, ti viene fornito un gran numero di servizi gratuiti per il trading efficiente.


