 Rimani

Condizioni di trading
Strumenti


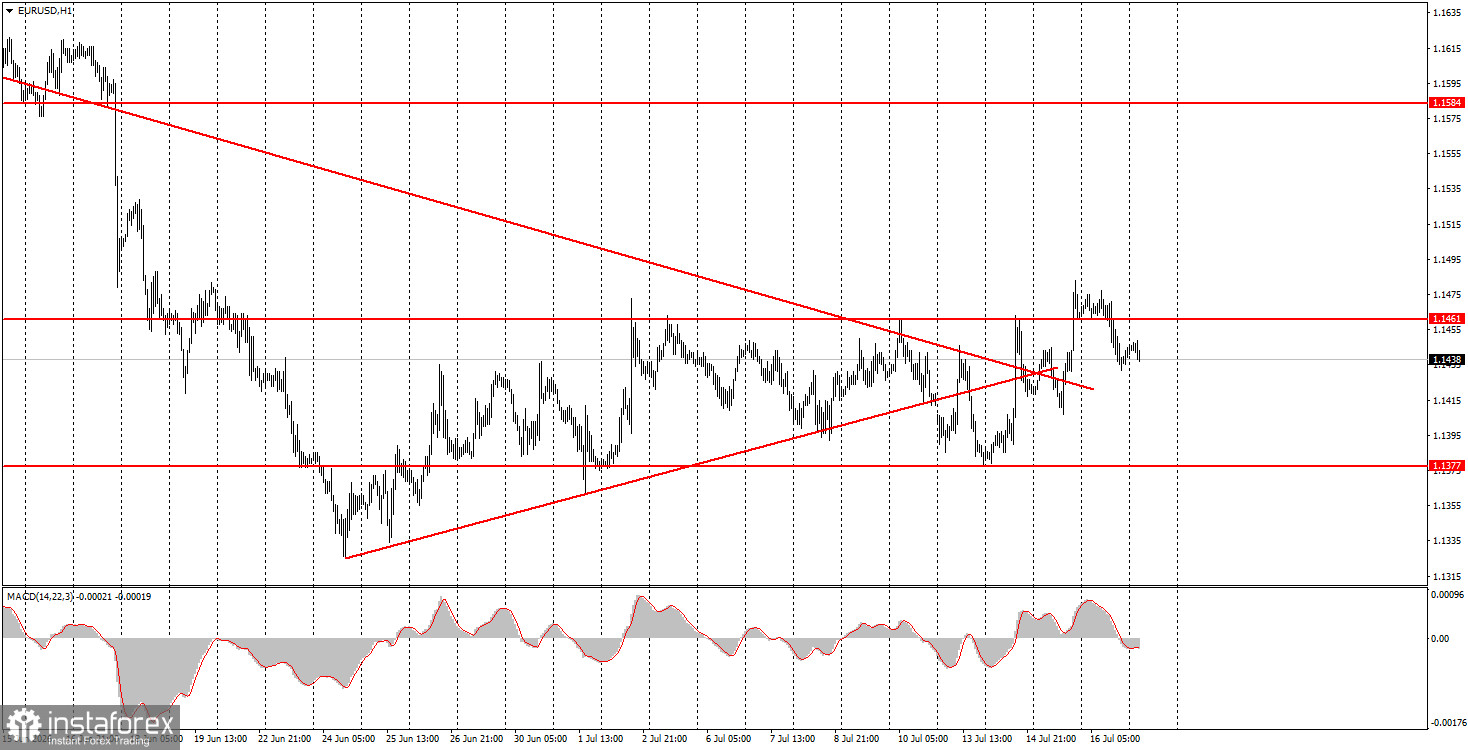
La coppia di valute EUR/USD non ha mostrato movimenti significativi durante la sessione di giovedì. Nei due giorni precedenti l'euro aveva registrato buoni rialzi — complessivamente circa 100 punti in due giorni — ma quel movimento è irrilevante, poiché la coppia si trova attualmente in un debole trend rialzista che sfiora la definizione di "flat". In effetti, questa fase di stallo si protrae ormai da diverse settimane. Il prezzo si muove per il 98% del tempo tra 1,1377 e 1,1461, nonostante formalmente il mercato sia in un trend rialzista. Ieri nell'area euro non sono usciti dati o eventi significativi; i report americani hanno provocato un lieve rafforzamento del dollaro perché non sono risultati peggiori delle attese, ma si è trattato di informazioni secondarie e non abbiamo visto movimenti ampi. Nelle ultime tre settimane, la coppia EUR/USD non solo è rimasta piatta, ma ha anche mostrato una volatilità estremamente bassa.
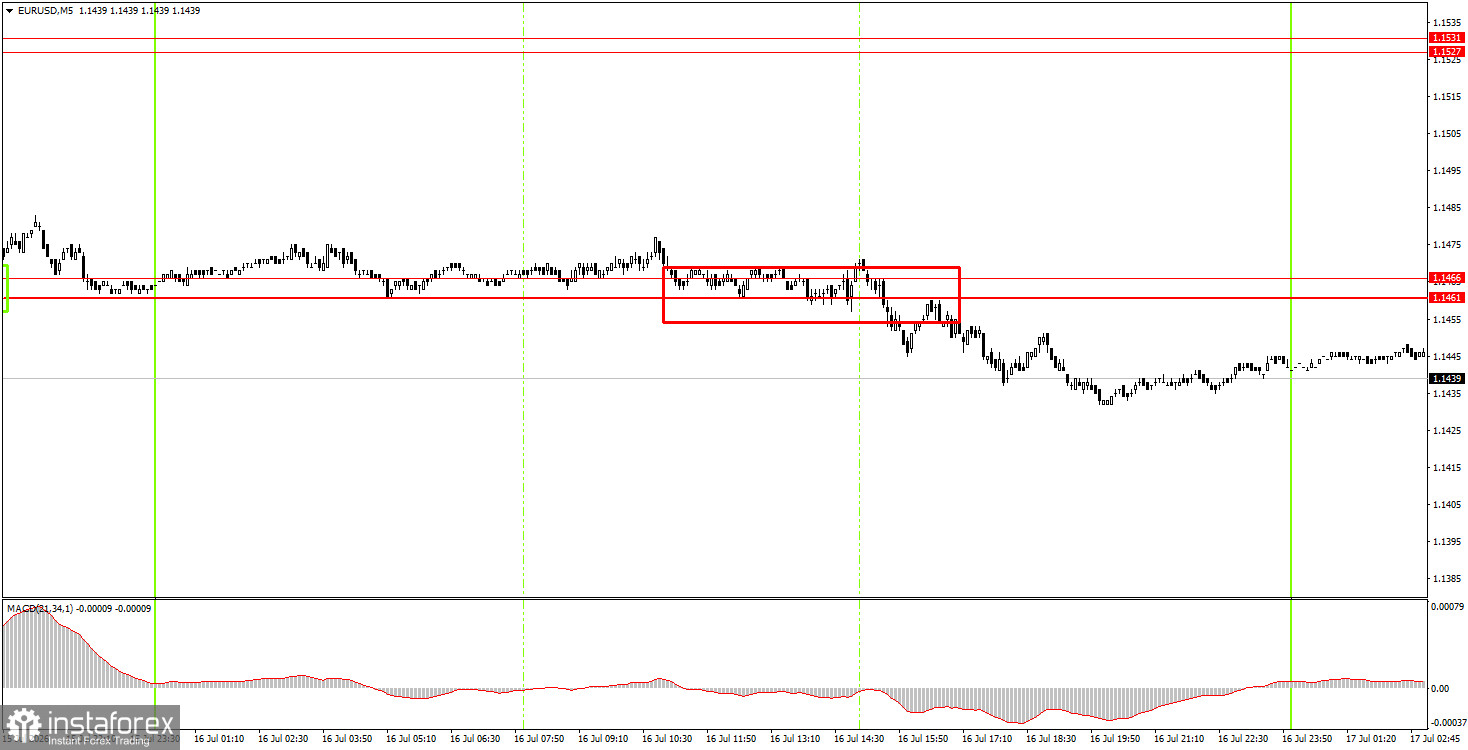
Sul TF a 5 minuti giovedì è stato generato un unico segnale di trading. Per alcune ore, in condizione di volatilità minima, il prezzo ha tentato più volte di superare la zona 1,1461–1,1466, riuscendovi infine. Non è seguito un forte impulso ribassista dopo il segnale, ma il prezzo è comunque riuscito a scendere di circa 15 punti.
Sul grafico orario entrambe le trendline sono state rotte e non sono più rilevanti. La fase laterale potrebbe essere terminata, dato che la coppia ha superato 1,1461. Considerando gli eventi e i movimenti recenti, riteniamo che l'euro dovrebbe continuare a salire e con forza superiore a quella vista finora. Tuttavia, praticamente tutto il rialzo attuale è una correzione; dopo la correzione è probabile riprenda il trend precedente.
Venerdì, i trader meno esperti possono mantenere posizioni short con obiettivi 1,1363–1,1377, dato che il prezzo si è attestato sotto l'area 1,1461–1,1466. Operazioni long possono essere aperte con target 1,1527–1,1531 se il prezzo si consolida sopra l'area 1,1461–1,1466. Non ci aspettiamo comunque movimenti particolarmente forti.
Livelli da considerare sul TF a 5 minuti: 1,1267–1,1275, 1,1363–1,1377, 1,1461–1,1466, 1,1527–1,1531, 1,1584–1,1594, 1,1655–1,1666, 1,1745–1,1754. Venerdì l'Unione Europea pubblicherà la sua seconda stima dell'inflazione per giugno, che non riveste particolare interesse. Negli Stati Uniti, oggi saranno pubblicati i dati sul mercato delle costruzioni e l'indice di fiducia dei consumatori dell'Università del Michigan, che non sono tra i report più importanti.
1. La forza del segnale è determinata dal tempo impiegato per la sua formazione (rimbalzo o rottura del livello). Più velocemente si forma, più forte è il segnale.
2. Se due o più operazioni vengono aperte vicino a un certo livello sulla base di falsi segnali, tutti i segnali successivi da quel livello vanno ignorati.
3. In una fase laterale (flat), qualsiasi coppia di valute può generare molti falsi segnali o non generarli affatto. In ogni caso, al primo segno di flat, è meglio smettere di fare trading.
4. Le operazioni si aprono nel periodo compreso tra l'inizio della sessione europea e la metà di quella americana; dopodiché tutte le posizioni devono essere chiuse manualmente.
5. Sul grafico a 1 ora, si può fare trading utilizzando i segnali dell'indicatore MACD solo se c'è una buona volatilità e una tendenza, confermata dalla linea di tendenza o dal canale di tendenza.
6. Se due livelli si trovano troppo vicini tra loro (da 5 a 20 punti), dovrebbero essere considerati come un'area di supporto o resistenza.
7. Dopo un movimento di 15 punti nella direzione corretta, è opportuno impostare lo Stop Loss al punto di pareggio.
I livelli di supporto e resistenza sono livelli che servono da target quando si aprono ordini di acquisto o di vendita. I livelli Take Profit possono essere impostati vicino ad essi;
Le linee rosse sono canali o linee di tendenza che mostrano la tendenza attuale e indicano in quale direzione è preferibile fare trading adesso;
L'indicatore MACD (14,22,3) - istogramma e linea di segnale - è un indicatore ausiliario che può essere utilizzato anche come fonte di segnali.
Interventi e rapporti importanti (sono sempre presenti nel calendario delle notizie) possono influenzare fortemente il movimento della coppia di valute. Pertanto, durante la loro pubblicazione, è consigliabile operare con estrema cautela o uscire dal mercato per evitare una brusca inversione di prezzo rispetto al movimento precedente.
I principianti nel trading Forex dovrebbero ricordare che non tutte le operazioni possono essere redditizie. L'elaborazione di una strategia chiara e la gestione del denaro sono la chiave del successo nel trading a lungo termine.
Le recensioni analitiche di InstaForex ti renderanno pienamente consapevole delle tendenze del mercato! Essendo un cliente InstaForex, ti viene fornito un gran numero di servizi gratuiti per il trading efficiente.


