 Rimani

Condizioni di trading
Strumenti


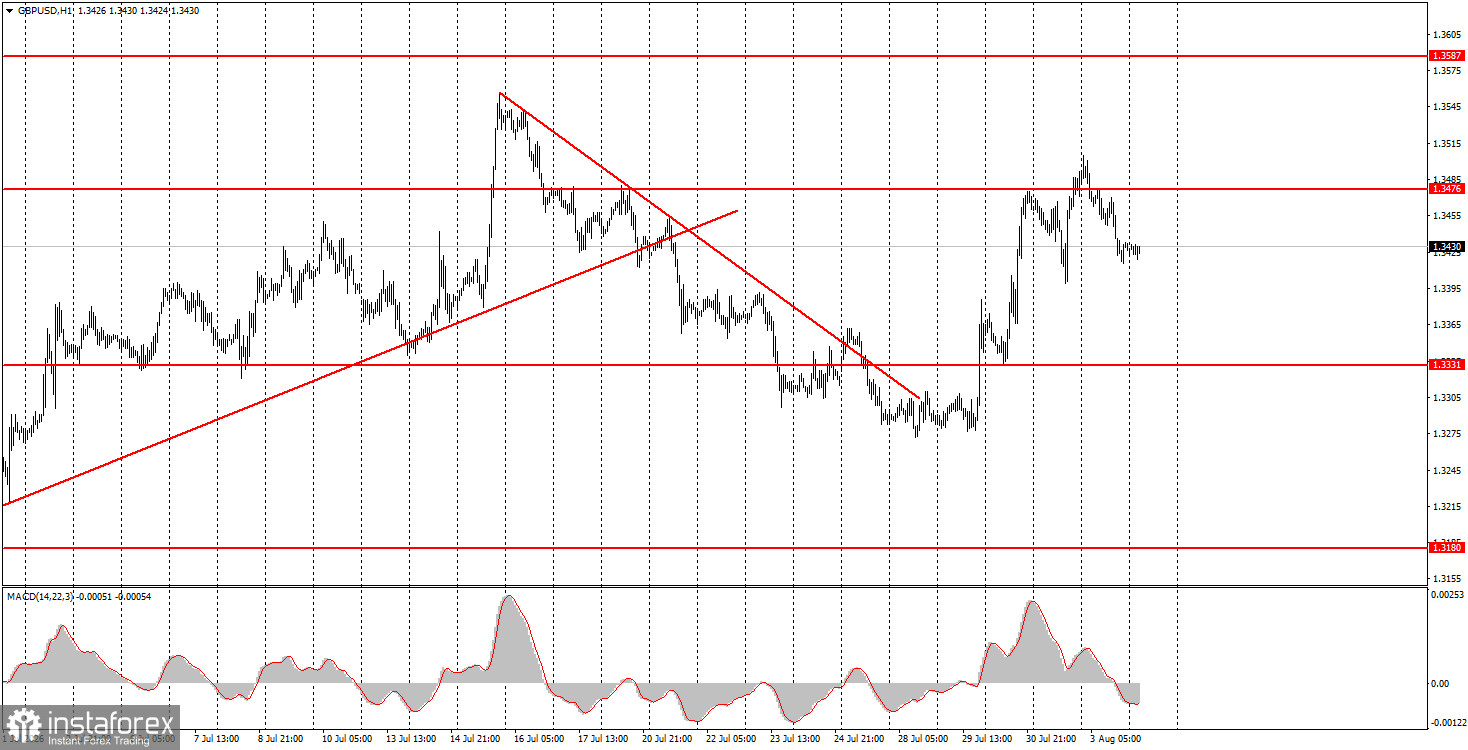
The GBP/USD pair also pulled back slightly on Monday, under pressure from positive U.S. macroeconomic data and a technical need for a correction. The only important report of the day—the ISM index in the U.S.—supported the U.S. currency, but we wouldn't expect a strong and prolonged decline in the pair. Geopolitics is no longer supporting the dollar as it once did, and the market is slowly readjusting from a "hawkish" stance on Federal Reserve monetary policy to a more dovish one. This week, only U.S. labor market data could provide strong support for the dollar. Currently, there is a prevailing sentiment in the market that the labor market and unemployment reports will miss on Friday. Still, we would like to remind readers that any forecasts are just that—forecasts. Friday's reports could easily be better than market expectations. In this case, the dollar would show significant growth as the Fed would lose the blocking factor against tightening monetary policy. Only high inflation would remain...
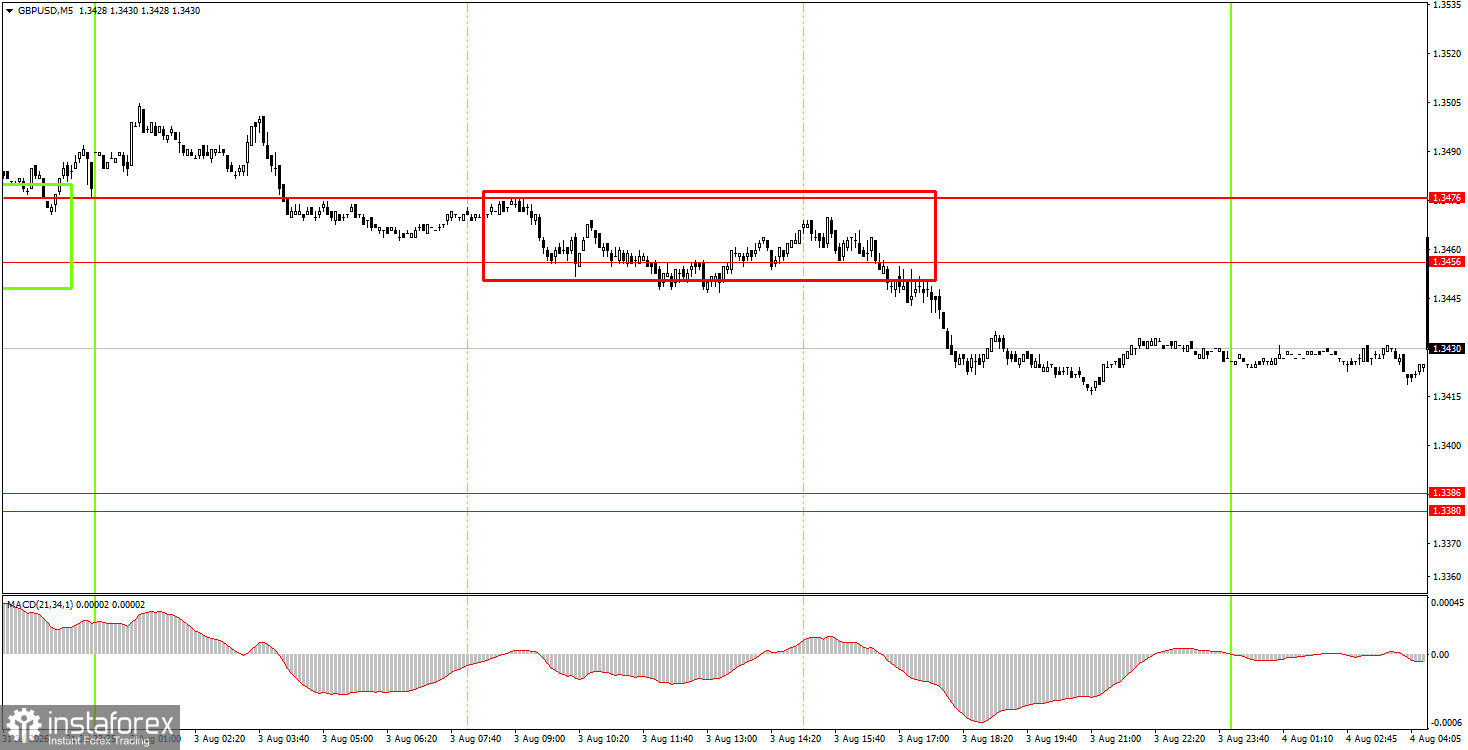
On the 5-minute timeframe, a trading signal was formed on Monday. The price spent the entire European trading session within the 1.3456-1.3476 range, but during the American session it broke out of this area, allowing short positions to open. By the end of the day, the pair had dropped by 25 pips but could continue its corrective decline today.
On the hourly timeframe, the GBP/USD pair has begun a new upward trend. In our opinion, the British pound will continue to rise, even if local factors do not support it. On the weekly timeframe, movement from the lower boundary of the sideways channel to the upper boundary started a month ago. And this movement is not yet complete. The Fed did not support the dollar, and geopolitics cannot sustain it forever, so we see no reason for the American currency to strengthen anew.
On Tuesday, novice traders may remain in short positions, as a sell signal formed on Monday in the 1.3456-1.3476 area, with a target of 1.3380-1.3386. Long positions can be considered if there is consolidation above the 1.3456-1.3476 area, with targets at 1.3587-1.3598.
On the 5-minute timeframe, trading levels of 1.3096-1.3107, 1.3175-1.3180, 1.3259-1.3267, 1.3319-1.3331, 1.3380-1.3386, 1.3456-1.3476, 1.3587-1.3598, 1.3631-1.3641, and 1.3695 can now be considered. On Tuesday, there are no significant events planned in the UK, and the U.S. will release the JOLTs report on open job vacancies for June. This report is not considered important. Volatility today may be low.
Support and resistance price levels (areas) are the targets when opening buy or sell orders or sources of signals. Red lines denote channels or trend lines that reflect the current trend and indicate in which direction trading is currently favored. The MACD indicator (14,22,3) – histogram and signal line – is a supporting indicator that can also be used as a source of signals.
Important speeches and reports (as listed in the news calendar) can significantly influence the movement of the currency pair. Therefore, during their release, trading should be approached with utmost caution, or one should exit the market to avoid sharp price reversals against the preceding movement.
Beginners in Forex trading should remember that not every trade can be profitable. Developing a clear strategy and proper money management are essential for long-term trading success.
Le recensioni analitiche di InstaForex ti renderanno pienamente consapevole delle tendenze del mercato! Essendo un cliente InstaForex, ti viene fornito un gran numero di servizi gratuiti per il trading efficiente.


