 Rimani

Condizioni di trading
Strumenti


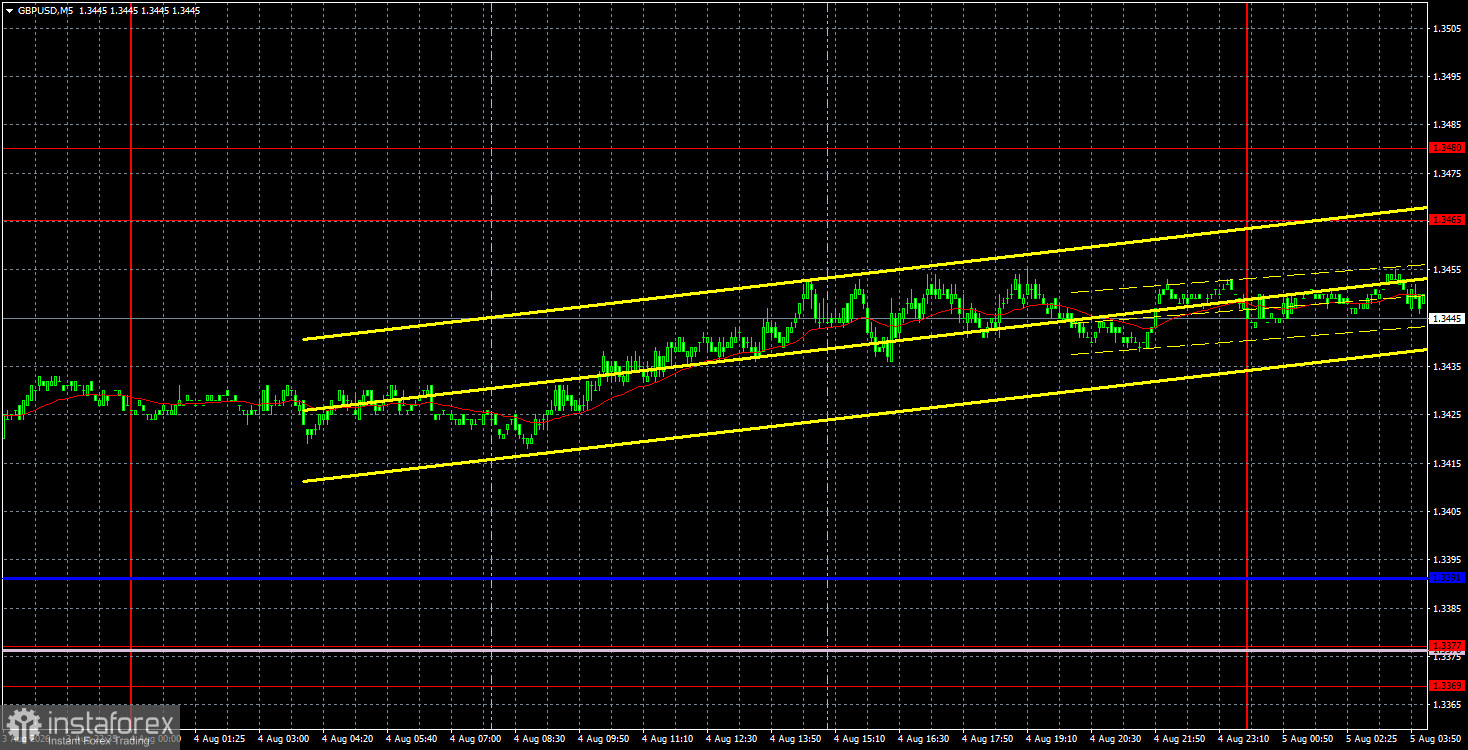
The GBP/USD currency pair also moved with minimal volatility on Tuesday, and the only report of the day—the JOLTs report on open job vacancies—did not interest traders. As a result, we witnessed dull, dreary movement throughout the day, and even geopolitics failed to move the pair away from its "dead" point. We have been saying for several months that geopolitics will not consistently exert the same influence on the dollar as it did in the initial months of the conflict in the Middle East. Essentially, the market is now ignoring all incoming information from the Middle East. This week, it became known that Donald Trump intends to sign a deal with Iran, while Iran has not heard anything about it. Following this, the U.S. president announced that new strikes would be launched against Iran if Tehran refuses negotiations and an agreement. Therefore, Trump and Iran currently seem to be living in different universes. What is actually happening and where this will lead is unknown. Essentially, only oil is reacting to the constantly changing geopolitical backdrop. This week, Brent prices dropped to $83 per barrel, although the Strait of Hormuz remains about 90% closed. The currency market, however, is awaiting U.S. labor and unemployment data.
From a technical perspective, the British pound continues to form an upward trend. It should be noted that, in the long term, the pair is in a range, as is clear on the weekly timeframe. After reaching the lower boundary of the sideways channel, a logical movement toward the upper boundary has begun, which is not yet complete.
On the 5-minute timeframe, no trading signals were formed on Tuesday. Throughout the day, volatility was so weak that the price was unable to work through any level or line. Thus, there were no grounds for opening trading positions.
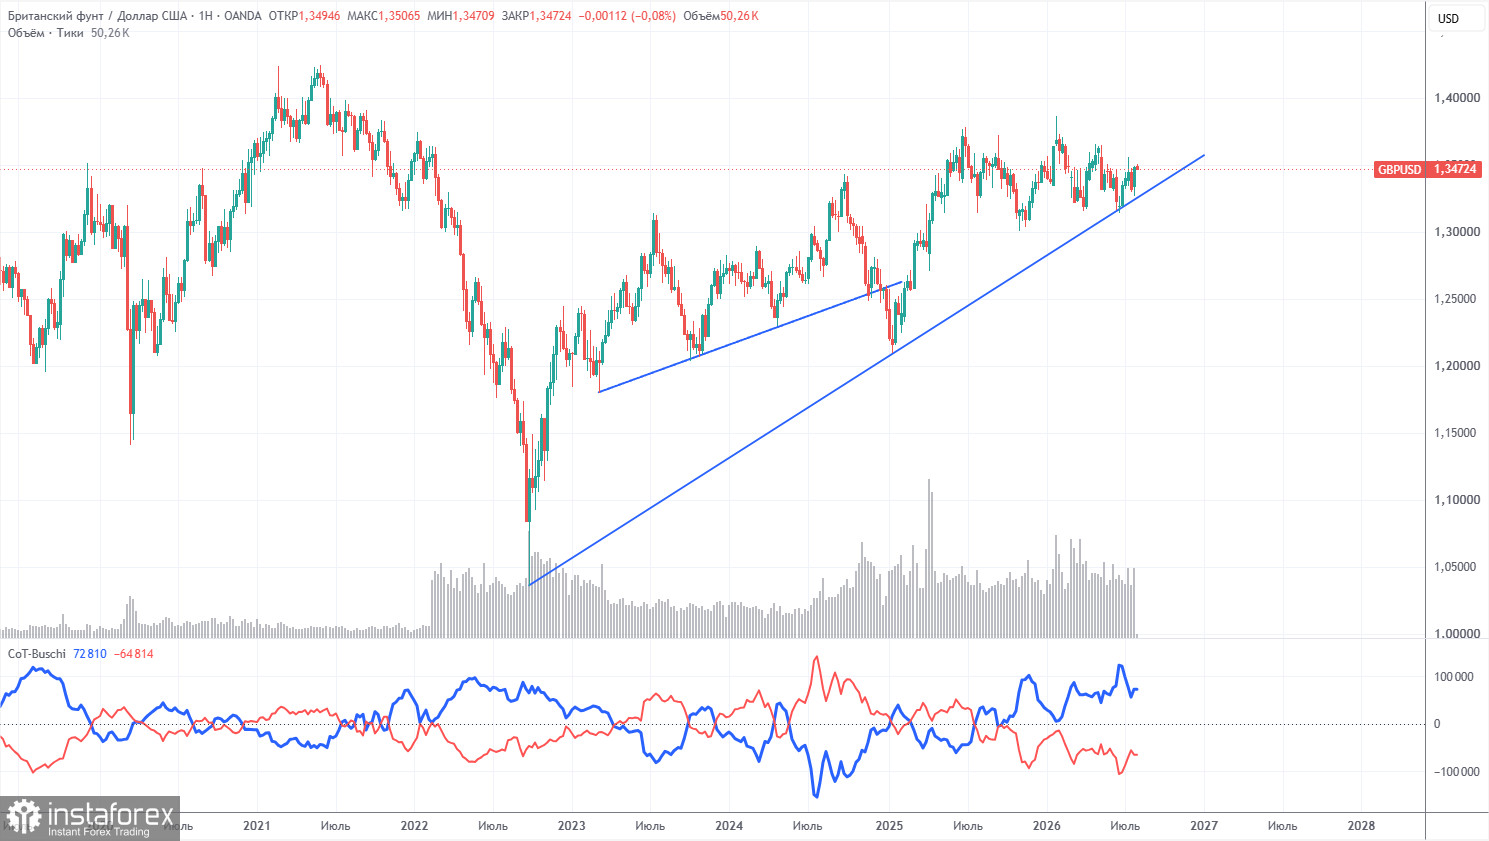
COT reports for the British pound show that non-commercial traders have dominated the market for several months with short positions. The net position is negative despite the long-term upward trend remaining intact. Given the events in the Middle East, it is no surprise that demand for risk currencies remains weak. The war is formally over, but the conflict continues. Geopolitics may support demand for the U.S. dollar in the near future. However, until consolidation below the trend line occurs, we wouldn't expect a significant drop in the pair.
In the long term, the dollar will continue to decline due to Donald Trump's policies, as is clearly evident on the weekly timeframe (illustration above). The trade war will continue in one form or another for a long time, and Trump's policies are aimed both directly and indirectly at weakening the American currency. The long-term upward trend remains, as evidenced by the trend line. The price recently tested this line and bounced off it. According to the latest COT report (from July 28), the "Non-commercial" group closed 2,800 BUY contracts and opened 6,400 SELL contracts. Thus, the net position of non-commercial traders decreased by another 9,200 contracts over the week.
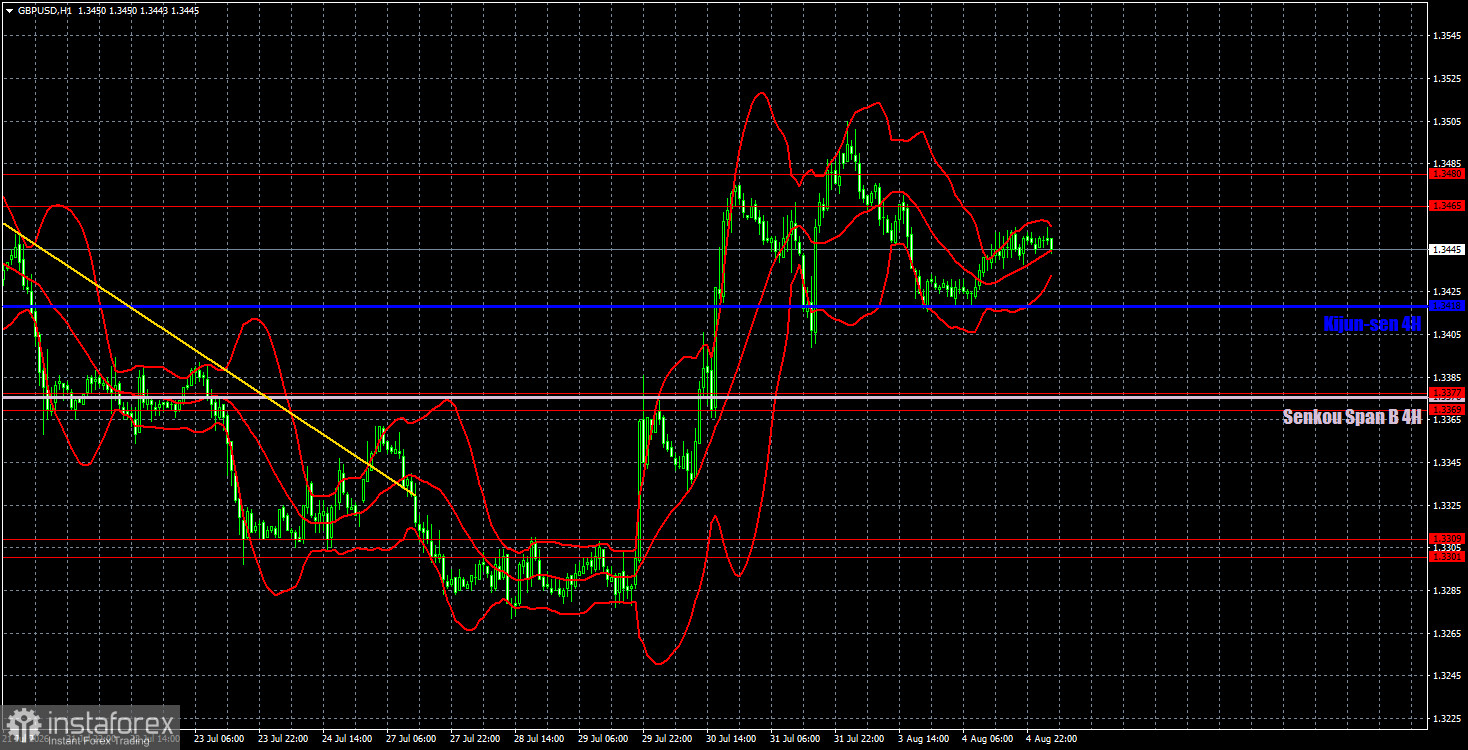
On the hourly timeframe, the GBP/USD pair continues to form an upward trend. In the long term, both European currencies still look upward and have been in sideways channels for an entire year. This does not negate the upward trend that began back in 2022. We expect the British pound to continue rising in the coming weeks, regardless of geopolitical and economic developments. This week, only U.S. labor market data could hinder the pound's growth.
For August 5, we highlight the following important levels: 1.3042-1.3050, 1.3096-1.3115, 1.3179-1.3187, 1.3301-1.3309, 1.3369-1.3377, 1.3465-1.3480, 1.3588, 1.3671-1.3681. The Senkou Span B line (1.3376) and Kijun-sen line (1.3418) may also serve as signal sources. It is recommended to set a Stop Loss at breakeven when the price moves in the correct direction by 20 pips. The Ichimoku indicator lines may move during the day, which should be taken into account when determining trading signals.
On Wednesday, the UK economic calendar is empty, while in the U.S., the ADP and ISM reports for the services sector will be released. We believe the ISM index is more important, and the market will react to it. As for the ADP report on private-sector employment changes, it is fairly inaccurate, and the market prefers to focus on NonFarm Payrolls.
Today, traders may open new short positions with targets at 1.3418 and 1.3377 if the price bounces off the 1.3465-1.3480 area. Long positions can be opened in the case of breaking through the area of 1.3465-1.3480 with a target of 1.3588.
Le recensioni analitiche di InstaForex ti renderanno pienamente consapevole delle tendenze del mercato! Essendo un cliente InstaForex, ti viene fornito un gran numero di servizi gratuiti per il trading efficiente.


