 Rimani
Condizioni di trading
Strumenti



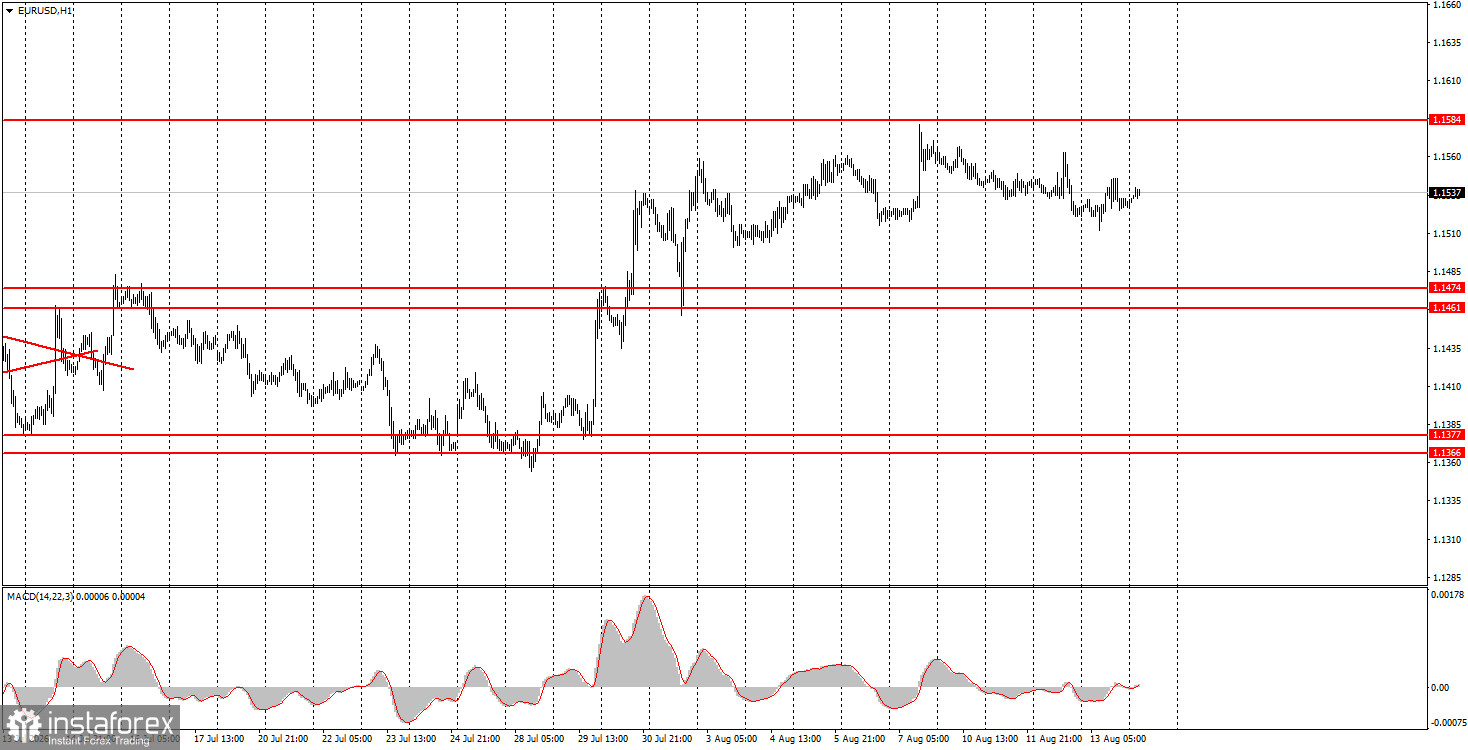
The EUR/USD currency pair traded on Thursday with no notable movement. On the hourly TF, it is clear that for almost two weeks, the euro has been in the 1.1500-1.1582 range. We cannot call this range a "classic flat," but in fact it is exactly that. The market this week does not react to either important data or secondary data. Yesterday, the industrial production report in the European Union and the US Producer Price Index did not cause any market reaction. Earlier, the US inflation report was also ignored. The upward trend persists after the end of the monthly flat, but after a week of growth, the European currency again demonstrates its weakness, and the market — its unwillingness to move.
Meanwhile, the question of Federal Reserve monetary tightening in September can probably be closed at least until September. In September, new inflation and labor market reports will be released, which may force traders to change their views. But right now there are no grounds for the Fed to raise the key rate.
On the hourly timeframe, the price left the sideways channel it spent a month in and has been forming an upward trend that has, frankly, faded over the last two weeks. Taking into account all the events of recent months, we believe that the European currency should continue confident growth. In recent months, the market has been diligently ignoring many factors in favor of the euro, so we continue to expect it to move higher.
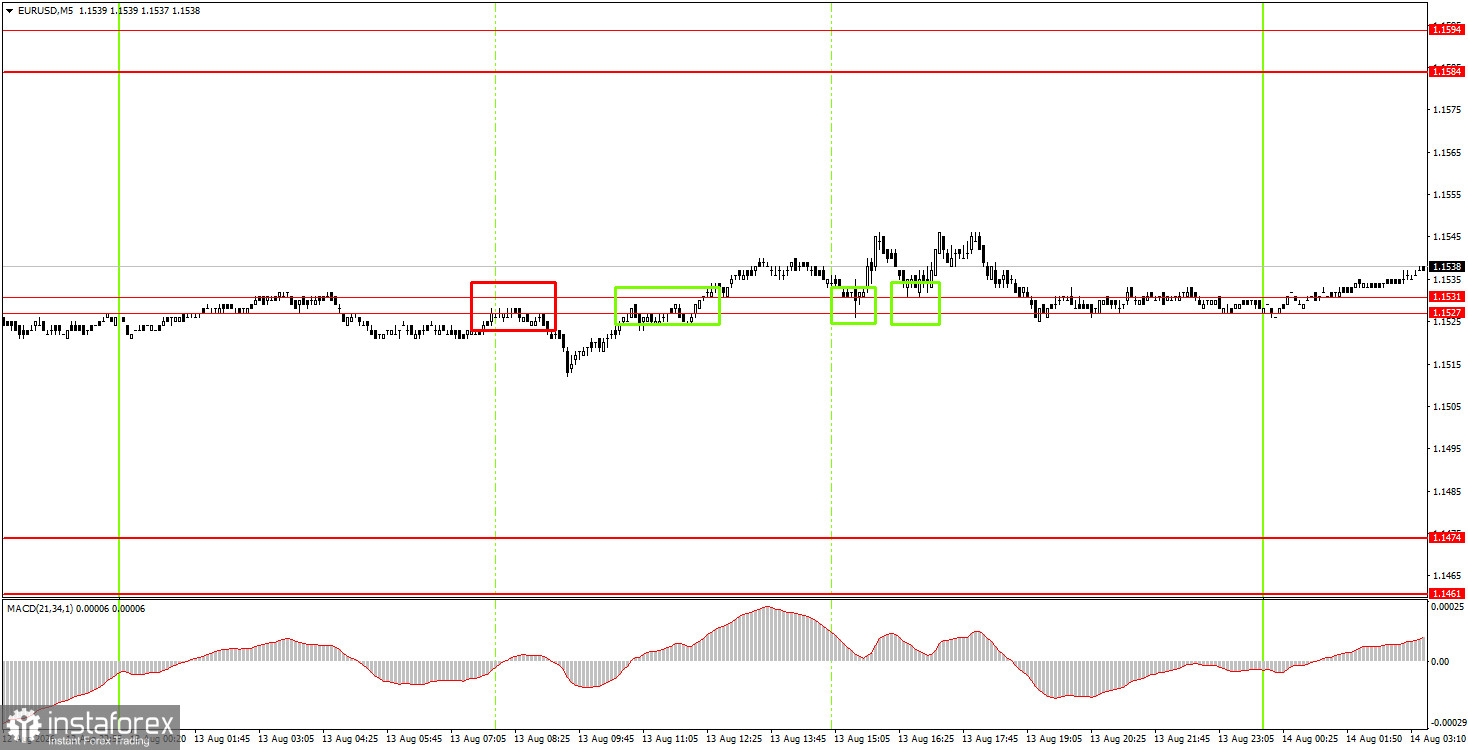
On Friday, novice traders can open short positions with the target 1.1461-1.1474 if the price consolidates below the area 1.1527-1.1531. Long positions can be opened in case of a new bounce from the area 1.1527-1.1531, with targets at 1.1584-1.1594. However, volatility is very low right now.
On the 5-minute TF, consider the levels 1.1267-1.1275, 1.1366-1.1377, 1.1461-1.1474, 1.1527-1.1531, 1.1584-1.1594, 1.1655-1.1666, 1.1745-1.1754. On Friday, the EU is scheduled to publish Q2 GDP, and in the US, retail sales and the University of Michigan consumer sentiment index. All three reports are unlikely to provoke strong movements.
Support and resistance price levels (areas) are the targets when opening buy or sell orders or sources of signals.
Red lines denote channels or trend lines that reflect the current trend and indicate in which direction trading is currently favored.
The MACD indicator (14,22,3) – histogram and signal line – is a supporting indicator that can also be used as a source of signals.
Important speeches and reports (as listed in the news calendar) can significantly influence the movement of the currency pair. Therefore, during their release, trading should be approached with utmost caution, or one should exit the market to avoid sharp price reversals against the preceding movement.
Beginners in Forex trading should remember that not every trade can be profitable. Developing a clear strategy and proper money management are essential for long-term trading success.
Le recensioni analitiche di InstaForex ti renderanno pienamente consapevole delle tendenze del mercato! Essendo un cliente InstaForex, ti viene fornito un gran numero di servizi gratuiti per il trading efficiente.


