 Rimani
Condizioni di trading
Strumenti



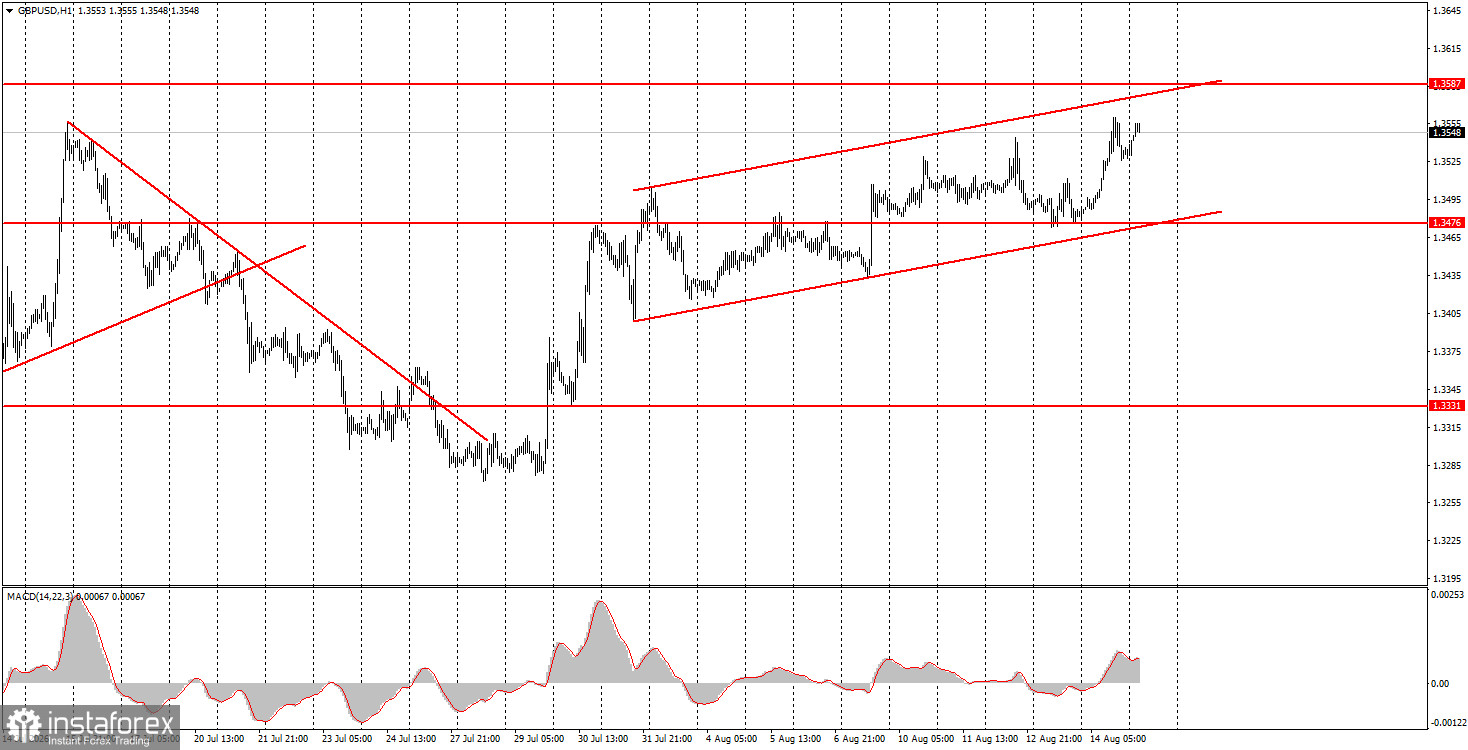
The GBP/USD pair continued its upward movement on Friday within the rising channel on the hourly timeframe. Thus, even on the hourly chart, technical factors currently support further growth of the British currency. On Friday, US macroeconomic data created additional problems for the dollar, as reports on retail sales and consumer sentiment showed weaker-than-expected readings. As a result, all key reports regarding the state of the US economy in recent times have been weak. The probability of the Federal Reserve tightening monetary policy in September is approaching zero, and in the longer term, it is simply declining. This week, the UK will release the July inflation report, which could significantly enhance the chances of seeing tightening of the Bank of England's monetary policy this fall. Thus, the pound may gain another growth factor this week. Overall, we continue to believe that the GBP/USD pair is targeting the 1.3900 level, which was reached earlier this year and marked a 4-year high.
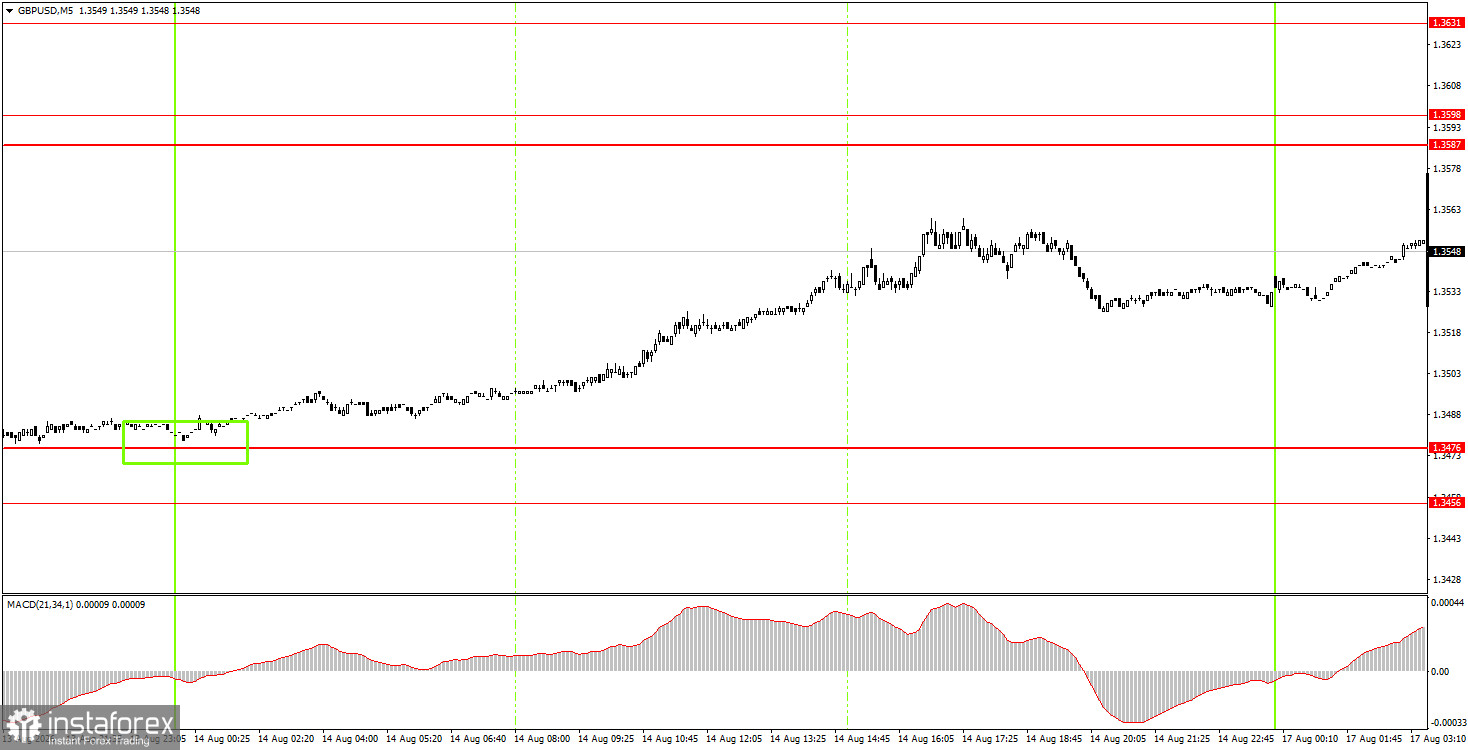
On the 5-minute timeframe, one buy signal was generated on Friday. Earlier in the night, the price rebounded from the 1.3456-1.3476 area, allowing novice traders to open long positions even at the start of the European trading session. Throughout the day, the pair gained around 50 pips, providing a good profit on the trade, regardless of when it was closed.
On the hourly timeframe, the GBP/USD pair retains its upward trend. In our view, the pound sterling should continue rising, even if local factors do not support it. On the weekly timeframe, the movement from the lower boundary of the sideways channel to the upper boundary continues. This movement is not complete. Market confidence that the Fed will raise the key interest rate in September is diminishing, as recent US macroeconomic data has been weak. Only a consolidation below the upward channel on the hourly timeframe could allow the dollar to consider growth.
On Monday, novice traders may open short positions if there is a rebound in the 1.3587-1.3598 area, targeting 1.3456-1.3476. Longs can be opened with a target of 1.3631-1.3641 if price consolidates above the 1.3587-1.3598 area.
On the 5-minute timeframe, consider trading levels of 1.3175-1.3180, 1.3259-1.3267, 1.3319-1.3331, 1.3380-1.3386, 1.3456-1.3476, 1.3587-1.3598, 1.3631-1.3641, and 1.3695. On Monday, there are no important events planned in the UK or the US, so volatility is likely to be low, and there may be no notable movements.
Support and resistance price levels (areas) are the targets when opening buy or sell orders or sources of signals.
Red lines denote channels or trend lines that reflect the current trend and indicate in which direction trading is currently favored.
The MACD indicator (14,22,3) – histogram and signal line – is a supporting indicator that can also be used as a source of signals.
Important speeches and reports (as listed in the news calendar) can significantly influence the movement of the currency pair. Therefore, during their release, trading should be approached with utmost caution, or one should exit the market to avoid sharp price reversals against the preceding movement.
Beginners in Forex trading should remember that not every trade can be profitable. Developing a clear strategy and proper money management are essential for long-term trading success.
Le recensioni analitiche di InstaForex ti renderanno pienamente consapevole delle tendenze del mercato! Essendo un cliente InstaForex, ti viene fornito un gran numero di servizi gratuiti per il trading efficiente.


