 Rimani

Condizioni di trading
Strumenti


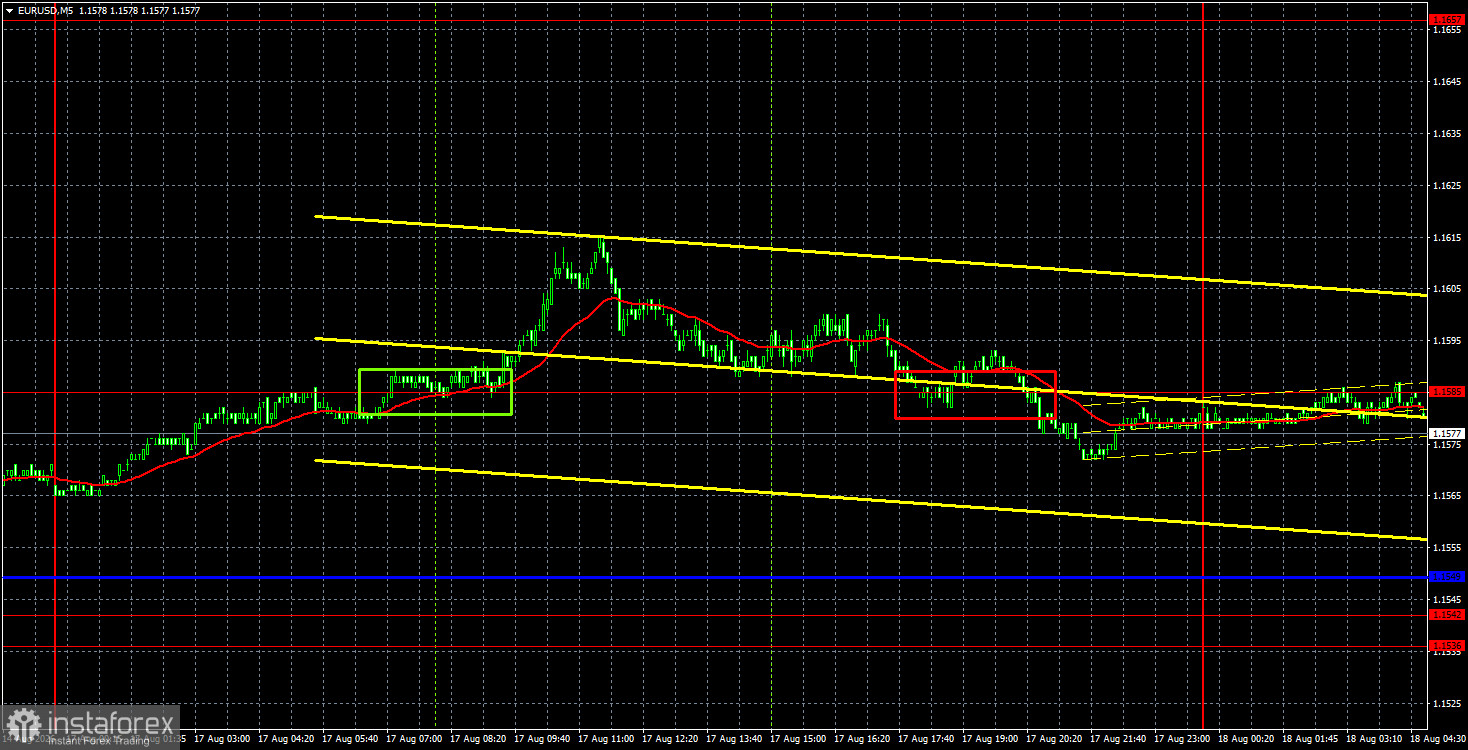
The EUR/USD currency pair showed notable movement on Monday. It should be noted that no important economic news was released during the day. Almost from the start of trading, the European currency began to rise, which fully corresponds to our expectations and forecasts. However, in the afternoon, information emerged that Iran plans to go on the offensive in the Strait of Hormuz and break the American blockade by military means. Naturally, this suggests an escalation of the conflict, with Tehran explicitly stating its intention to shift from a "completely defensive strategy" to an "offensive" one, as negotiations with Washington have reached a dead end. While these are still just threats, which we have heard countless times in recent months, there is a saying: there is no smoke without fire. If Iran proceeds to break the naval blockade, it will inevitably prompt further U.S. strikes. Such developments are unlikely to facilitate the reopening of the Strait of Hormuz. Consequently, the dollar saw minimal appreciation in the afternoon. However, we would not expect significant growth in the American currency: at most, a correction.
From a technical standpoint, the pair has left the sideways channel at 1.1362-1.1461 after a month of "struggling" and is now in an upward trend. This trend is weak and slow, but it should be noted that none of the global factors currently favor the U.S. currency. Only geopolitics can help it, specifically some significant event, not just the latest mutual shelling between Iran and the U.S.
On the 5-minute timeframe, on Monday, two trading signals were formed. At the very beginning of the European trading session, the price broke the 1.1585 level, allowing traders to open long positions. However, during the American session, the price settled below this level, allowing short positions to be opened. As of now, the pair has not shown any decline.
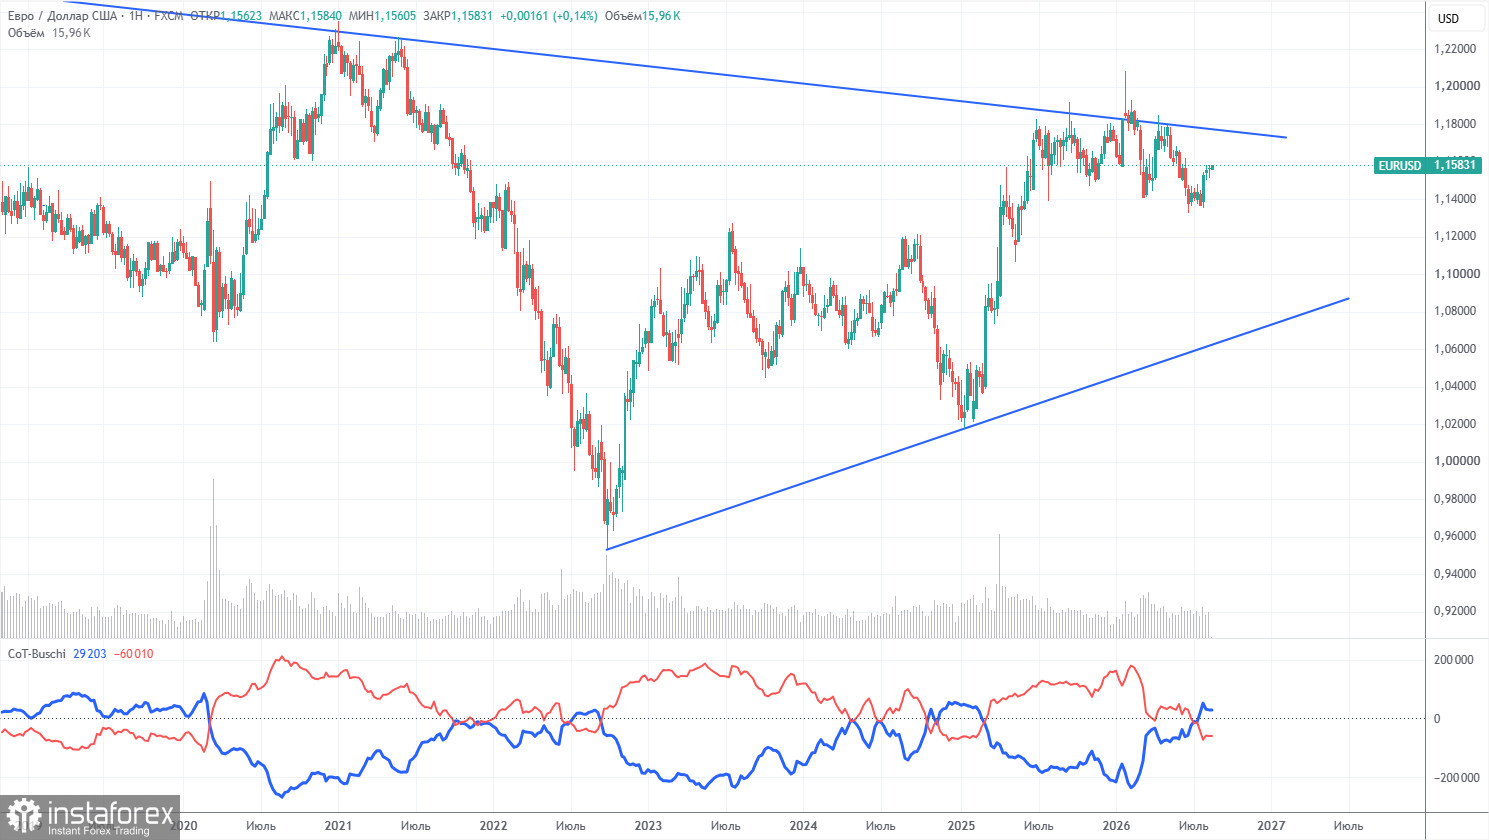
The latest COT report is dated August 11. On the weekly timeframe illustration, it is evident that the net position of non-commercial traders has become "bearish" and has significantly decreased in 2026 due to geopolitical events. Traders have been shedding European currency in favor of the U.S. dollar in recent months. Donald Trump's policies have not changed, but for a time, the dollar has acted as a "reserve currency."
We still do not see any fundamental factors for strengthening the European currency, but there remain sufficient reasons for the U.S. dollar's decline. The war in the Middle East made the dollar temporarily super-attractive, but once this factor loses its "expiry date," everything will return to normal. This process may have already concluded. In the long term, the euro could fall to levels around 1.08 (the trend line), but the upward trend will remain relevant. In recent months of dollar growth, the pair has not approached this line significantly.
The positioning of the red and blue lines of the indicator indicates parity between bulls and bears. During the last reporting week, the number of long positions in the "Non-commercial" group decreased by 4,600, while the number of shorts decreased by 2,700. Accordingly, the net position decreased by 1,900 contracts over the week.
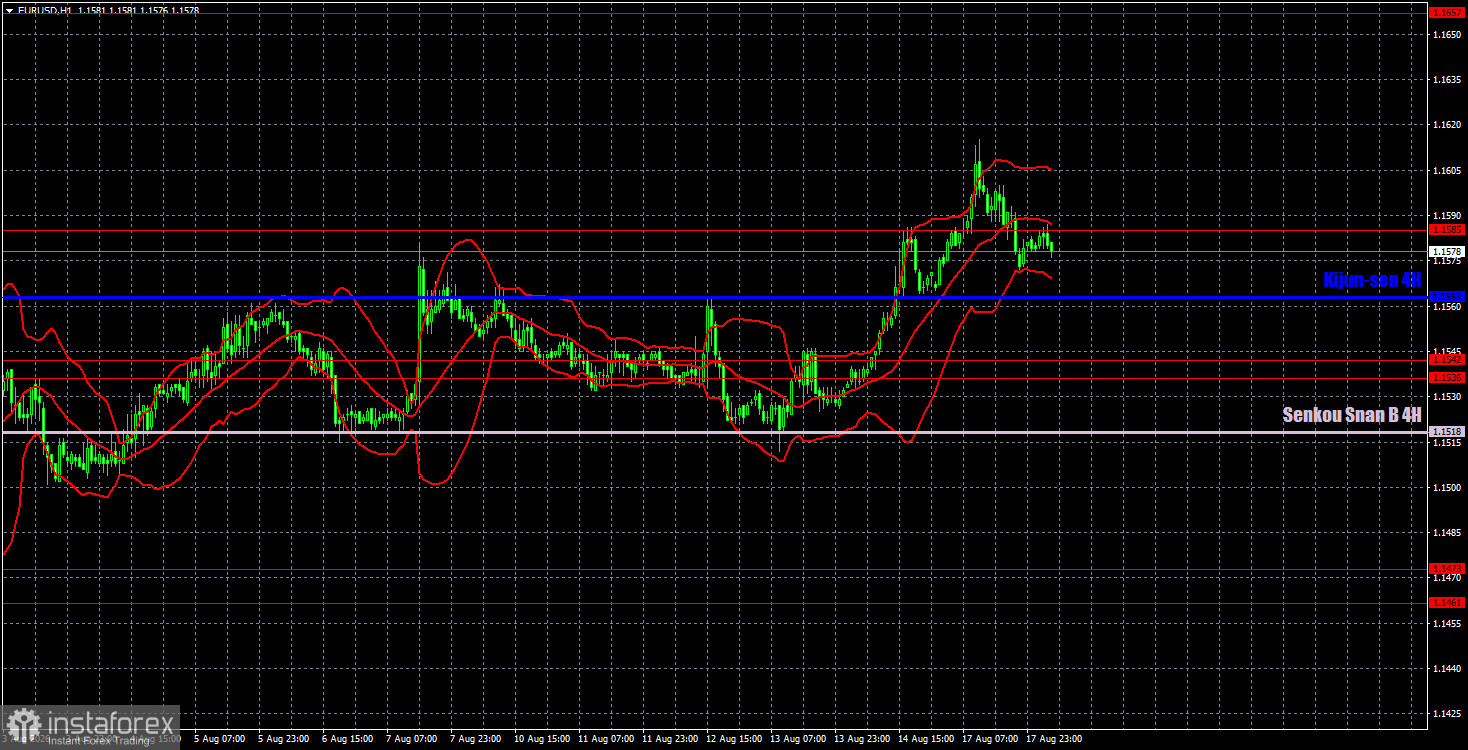
On the hourly timeframe, the pair maintains an upward trend. The situation in the Middle East remains tense and is not improving, but this is not enough for a new, powerful dollar rally. The market has ignored the positive factors for the euro in recent months and has focused solely on the Fed's monetary policy, placing inflated demands on it. Now, however, the European currency has every chance of medium-term growth, while the dollar can only expect a technical correction and geopolitical factors.
For August 18, we highlight the following trading levels: 1.1234, 1.1274, 1.1362-1.1368, 1.1461-1.1473, 1.1536-1.1542, 1.1585, 1.1657-1.1666, 1.1750-1.1760, 1.1786, 1.1830-1.1837, as well as the Senkou Span B line (1.1518) and the Kijun-sen line (1.1563). The Ichimoku indicator lines may shift during the day, which should be taken into account when determining trading signals. Do not forget to set stop-loss orders to break even if the price moves in the correct direction by 15 pips. This safeguards against potential losses if the signal proves false.
On Tuesday, ZEW's economic expectations indices will be published in the EU, while in the U.S., the ADP report, building permits issued, and new housing starts will be released. We consider all these reports to be secondary and do not expect strong market reactions to them.
Today, traders may remain in short positions with targets at 1.1563 and 1.1536-1.1542, as price has settled below 1.1585. A consolidation above 1.1585 will allow for long positions with targets around 1.1657-1.1666.
Le recensioni analitiche di InstaForex ti renderanno pienamente consapevole delle tendenze del mercato! Essendo un cliente InstaForex, ti viene fornito un gran numero di servizi gratuiti per il trading efficiente.


