 Rimani

Condizioni di trading
Strumenti


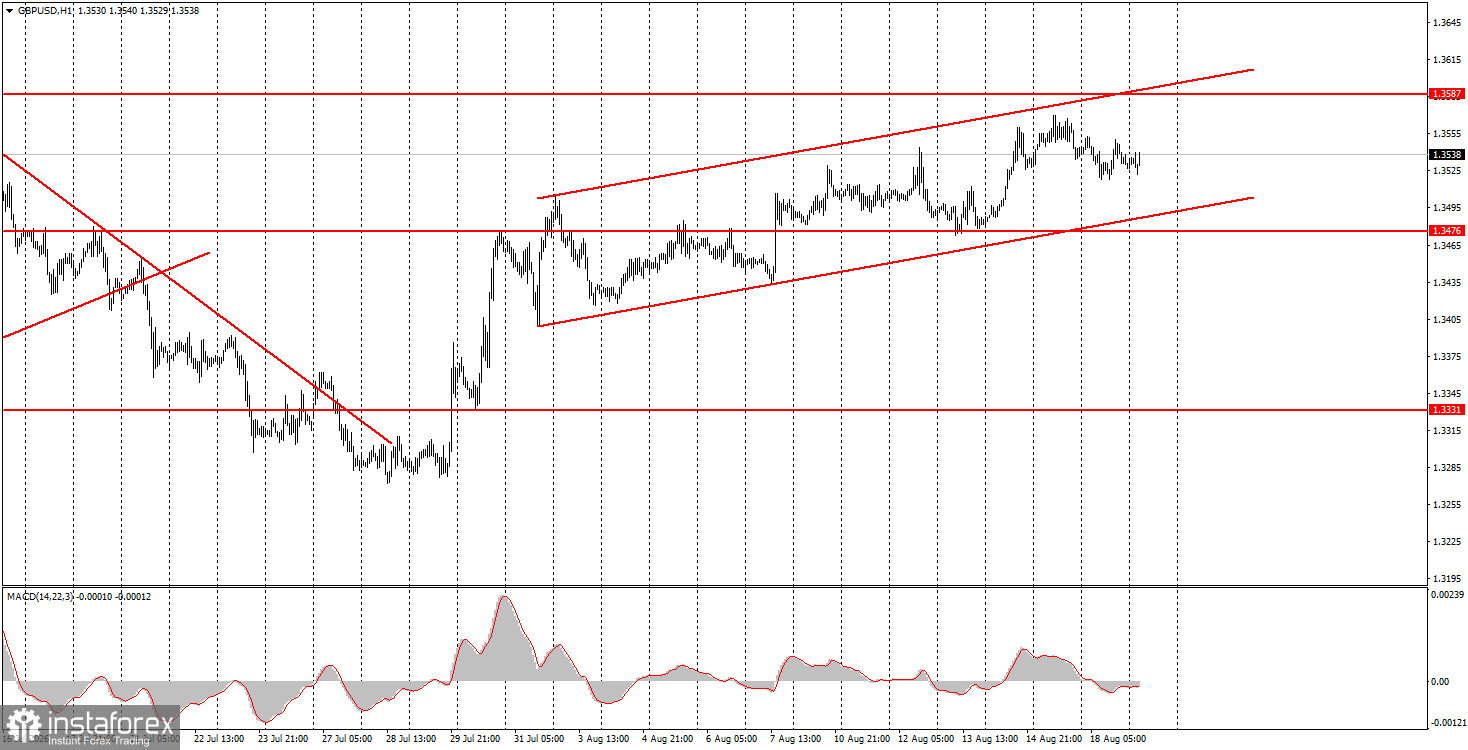
The GBP/USD pair continued its downward correction on Tuesday, which began on Monday. However, over two days of decline, the British pound lost only 50 pips. Yesterday, the British pound had the potential for interesting movements throughout the day, as several important reports were released in the UK. In particular, the unemployment rate came in lower than traders had anticipated. For June, the unemployment rate stood at 4.9%, while the market expected it to decrease to 4.8%. Thus, it can be said that the actual report value was worse than the forecasts, which may have triggered a decline in the British currency. We observed the decline but did not see volatility. The market remains within an upward channel, so the upward trend is maintained. Most factors still act against the U.S. dollar, and thus we expect further strengthening of the British pound under any circumstances. Today, traders should pay attention to the UK inflation report.
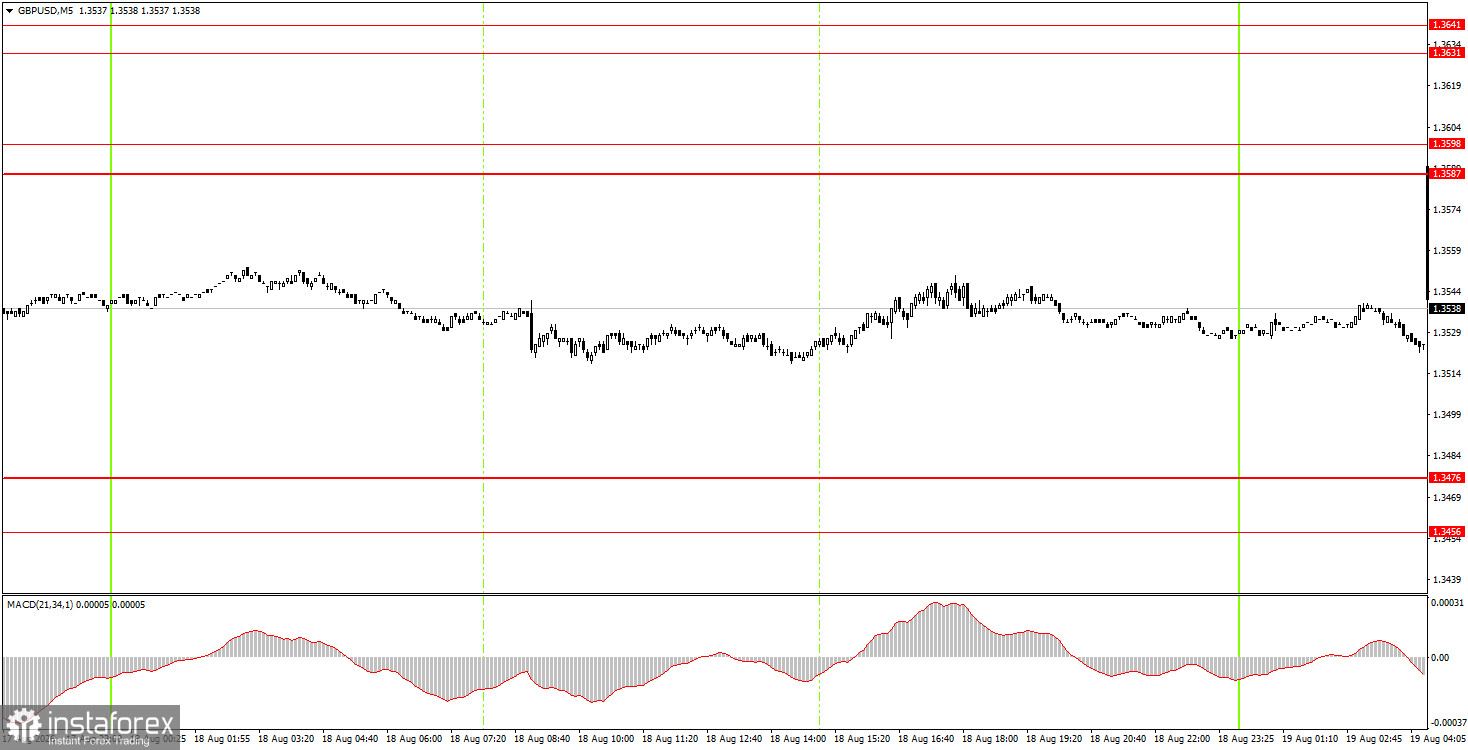
On the 5-minute timeframe, no trading signals were generated on Tuesday, as shown in the illustration above. Throughout the day, the price did not even approach significant levels or areas, so novice traders had no basis to enter the market. The GBP/USD pair moved solely sideways all day.
On the hourly timeframe, the GBP/USD pair maintains its upward trend. In our view, the British pound should continue to rise, even if local factors do not provide support. On the weekly timeframe, the move from the lower boundary of the sideways channel to the upper boundary continues, and it is not yet complete. The market's belief in a Federal Reserve rate hike in September is rapidly fading, as recent U.S. macroeconomic data has pressured the dollar. Only a consolidation below the upward channel on the hourly timeframe will suggest a potential decline for the pair.
On Wednesday, novice traders may open short positions if there is a rebound from the 1.3587-1.3598 area, targeting 1.3456-1.3476. Long positions can be opened with a target of 1.3587-1.3598 if the price rebounds from the 1.3456-1.3476 area.
On the 5-minute timeframe, the following levels should be considered for trading: 1.3175-1.3180, 1.3259-1.3267, 1.3319-1.3331, 1.3380-1.3386, 1.3456-1.3476, 1.3587-1.3598, 1.3631-1.3641, and 1.3695. On Wednesday, inflation data is scheduled for release in the UK, which is the most important event of the week. The greater the deviation from the forecast, the stronger the market reaction will be. In the U.S., only the minutes from the last FOMC meeting will be released, which has always been considered a formal event.
Support and resistance price levels (areas) are the targets when opening buy or sell orders or sources of signals.
Red lines denote channels or trend lines that reflect the current trend and indicate in which direction trading is currently favored.
The MACD indicator (14,22,3) – histogram and signal line – is a supporting indicator that can also be used as a source of signals.
Important speeches and reports (as listed in the news calendar) can significantly influence the movement of the currency pair. Therefore, during their release, trading should be approached with utmost caution, or one should exit the market to avoid sharp price reversals against the preceding movement.
Beginners in Forex trading should remember that not every trade can be profitable. Developing a clear strategy and proper money management are essential for long-term trading success.
Le recensioni analitiche di InstaForex ti renderanno pienamente consapevole delle tendenze del mercato! Essendo un cliente InstaForex, ti viene fornito un gran numero di servizi gratuiti per il trading efficiente.


