 Rimani
Condizioni di trading
Strumenti



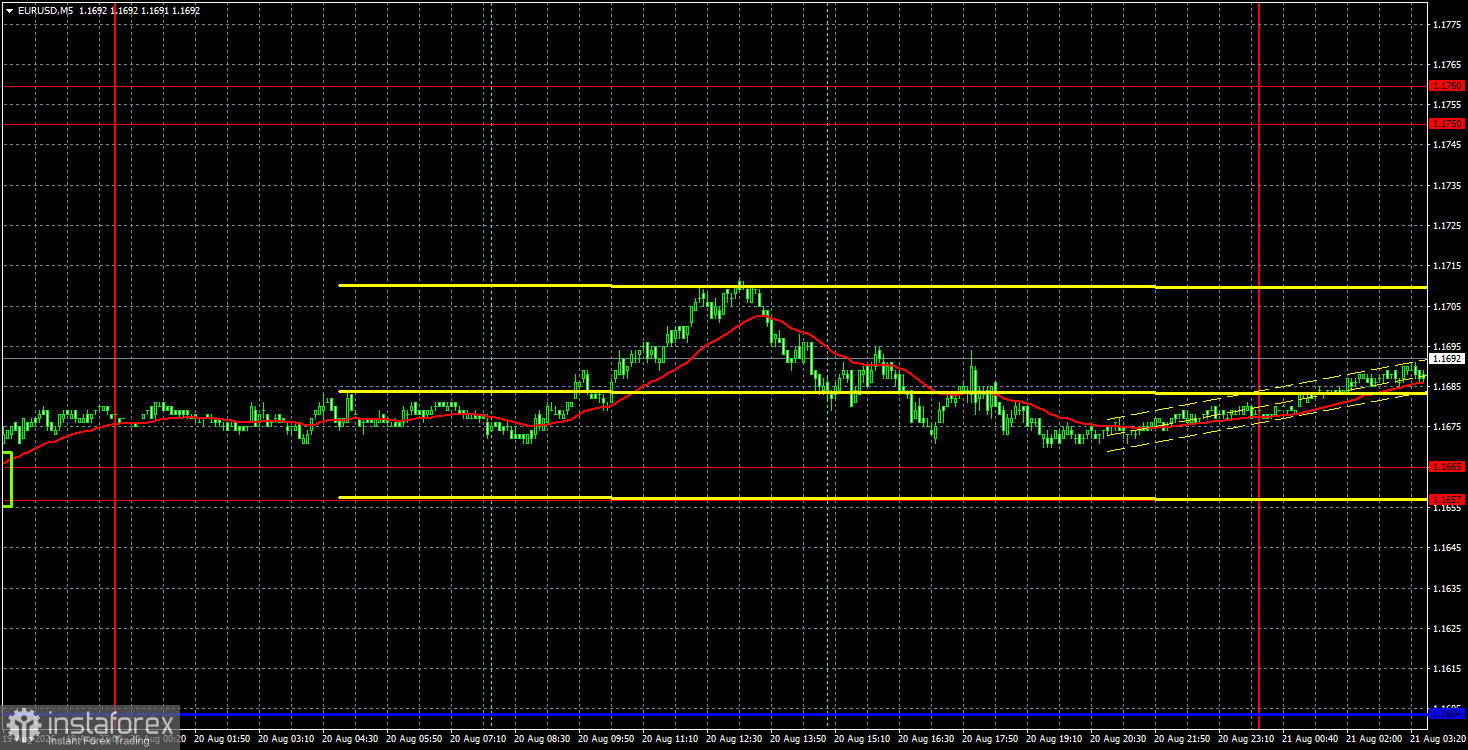
The EUR/USD currency pair struggled to appreciate on Thursday. Still, the corrective pullback was quite weak, which keeps the possibility of bulls renewing pressure at any moment. Most importantly, the pair ended the day above the 1.1657-1.1665 range. On Thursday, the macroeconomic and fundamental backdrop was virtually absent. Still, the market remained highly emotional after Wednesday, when the US Treasury announced an increase in the buyback of long-term bonds from the open market by twofold. Essentially, this decision signified to traders that serious problems had developed in the US economy. The decision to increase the buyback of long-term bonds will also both directly and indirectly decrease demand for the US currency. First, the yield on securities will decrease (which was the main goal of the Treasury's decision), and therefore, demand for bonds will drop, as will demand for the dollar needed to purchase these bonds. Secondly, America, under Donald Trump, is again suffering reputation damage. Confidence in the US, its economy, stability, and yield is declining every month, and the world has long since recalibrated itself for dedollarization. Thus, the fall of the US currency is the most logical scenario for future developments.
From a technical perspective, the pair continues to form an upward trend. The trend is not overly strong, but let us remember that none of the global factors are currently supporting the US currency. Only geopolitics can help it, but even that is not shining at the moment. The dollar has been thrown a 30-kilogram weight along with its lifebuoy.
On the 5-minute timeframe, no trading signals were formed on Thursday. The price approached the 1.1657-1.1665 range twice during the day but failed to act on it. However, two buy signals formed on Wednesday evening and remain relevant today.
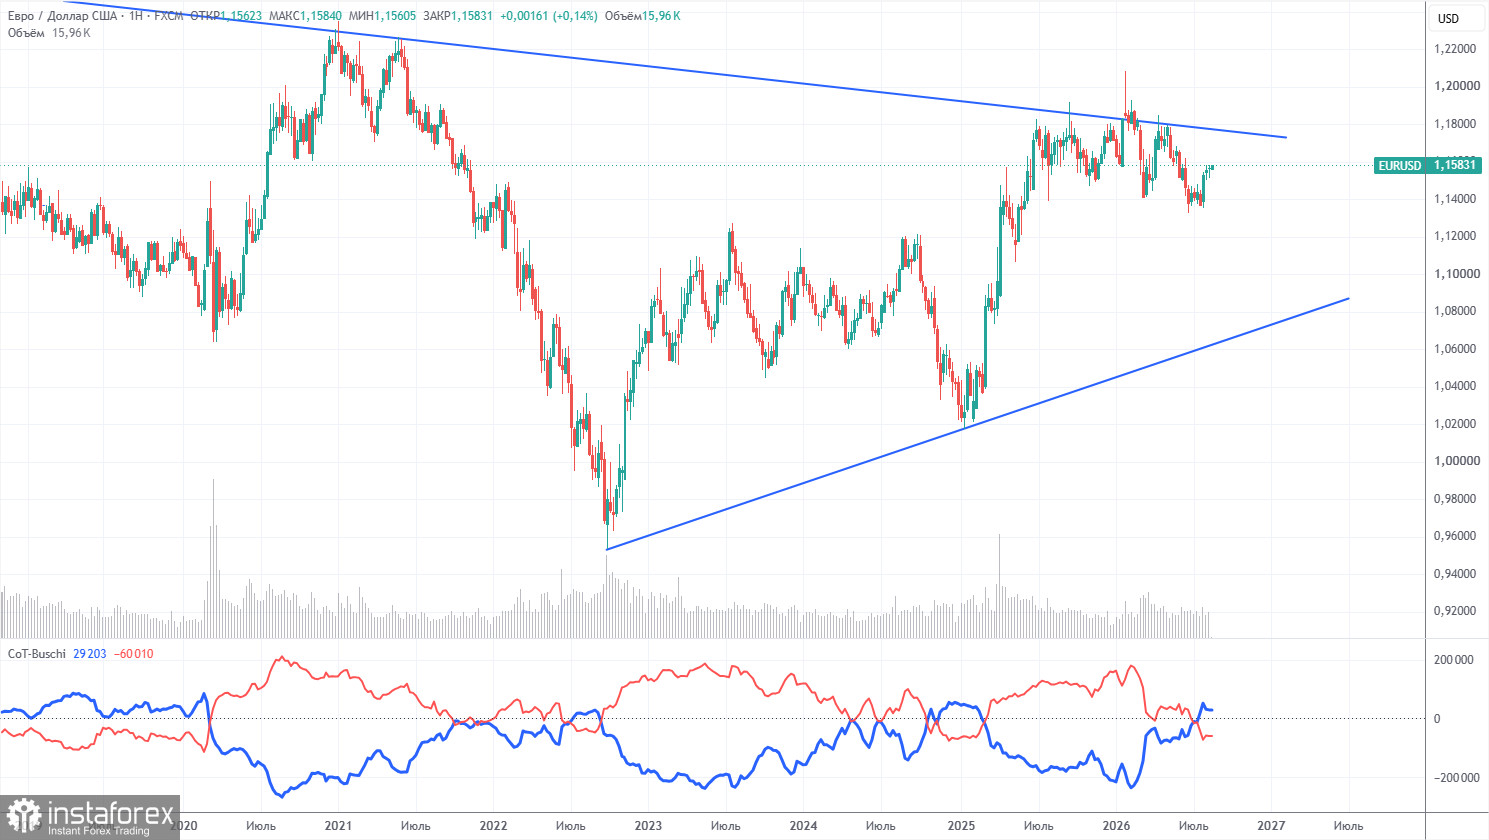
The last COT report is dated August 11. The illustration on the weekly timeframe clearly shows that the net position of non-commercial traders has turned "bearish" and has significantly decreased in 2026 due to geopolitical events. Traders have been getting rid of the euro in favor of the US dollar in recent months. Trump's policy has not changed, but the dollar has acted as a "reserve currency" for some time.
We still do not see any fundamental factors for the strengthening of the euro, but there are sufficient factors for the decline of the American currency. The war in the Middle East made the dollar temporarily super-attractive, but when this factor reaches its "expiration date," everything will revert to the way it was. This process could have already concluded. In the long term, the euro could fall to the $1.08 level (trend line), but the upward trend will remain relevant. Over the past months of dollar growth, the pair has not moved significantly closer to this line.
The positioning of the red and blue lines on the indicator indicates a balance between bulls and bears. During the last reporting week, the number of longs in the "Non-commercial" group decreased by 4,600, while the number of shorts decreased by 2,700. Consequently, the net position decreased by 1,900 contracts over the week.
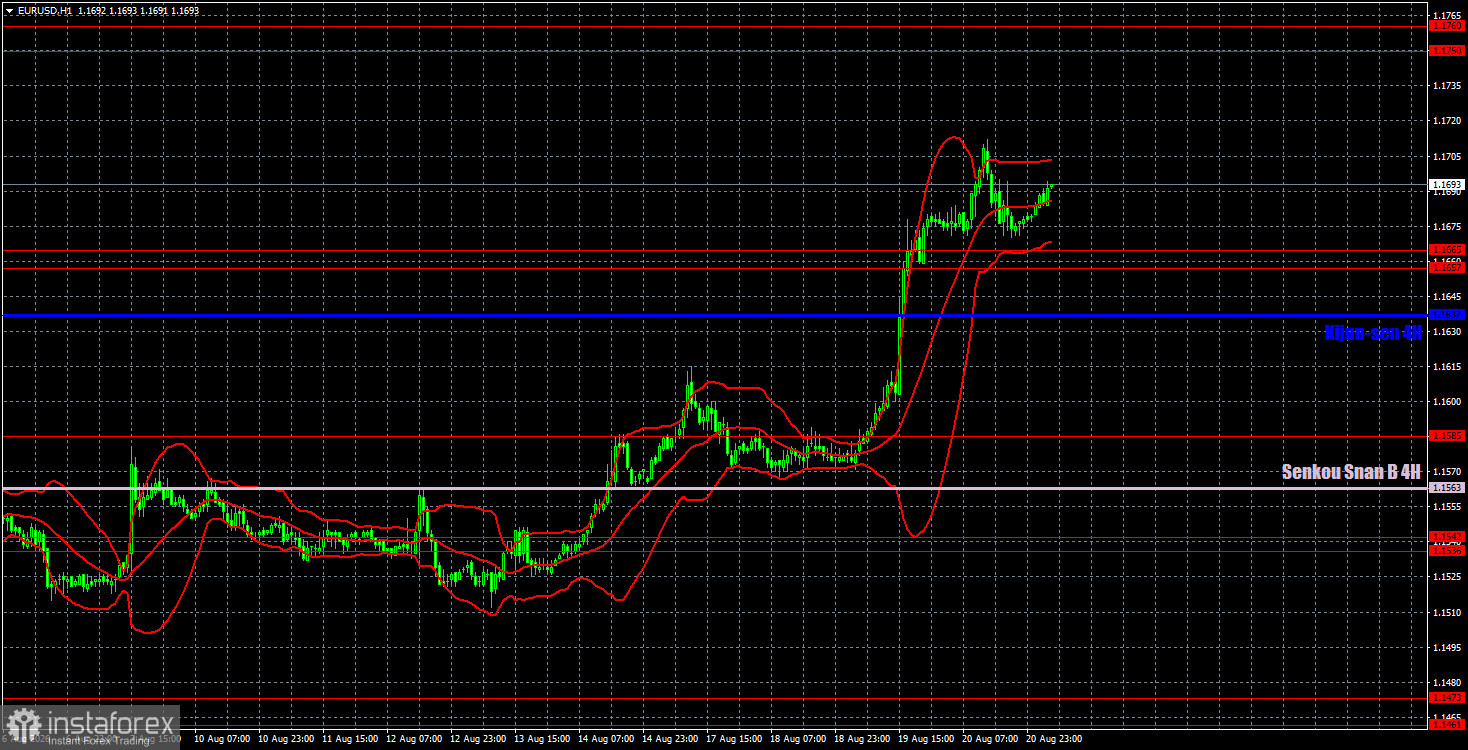
On the hourly timeframe, the pair maintains an upward trend. The situation in the Middle East remains tense and is not improving, but this is not sufficient for any substantial new growth in the dollar. The market has ignored all positive factors for the euro in recent months and has focused solely on the Federal Reserve's monetary policy, to which it has placed elevated demands. Currently, the European currency has all the chances of mid-term growth, while the dollar can only hope for a technical correction and geopolitical developments.
For August 21, we highlight the following levels for trading: 1.1234, 1.1274, 1.1362-1.1368, 1.1461-1.1473, 1.1536-1.1542, 1.1585, 1.1657-1.1665, 1.1750-1.1760, 1.1786, 1.1830-1.1837, as well as Senkou Span B (1.1563) and Kijun-sen (1.1637) lines. The Ichimoku indicator lines may fluctuate during the day, which should be taken into account when determining trading signals. Don't forget to implement a stop-loss order at breakeven if the price moves 15 pips in the right direction. This will protect against potential losses if the signal proves false.
On Friday, indices of business activity in the services and manufacturing sectors are scheduled for publication in the Eurozone, Germany, and the US. We consider the European indices the most important, but overall the market reaction to these reports may be weak, and the dollar may resume its decline given previous events.
Today, traders can consider short positions with targets at 1.1637 and 1.1585 if the price consolidates below the 1.1657-1.1665 range. Consolidation above the range of 1.1657-1.1665 allows for holding long positions with a target in the area of 1.1750-1.1760.
Le recensioni analitiche di InstaForex ti renderanno pienamente consapevole delle tendenze del mercato! Essendo un cliente InstaForex, ti viene fornito un gran numero di servizi gratuiti per il trading efficiente.


