 Rimani
Condizioni di trading
Strumenti



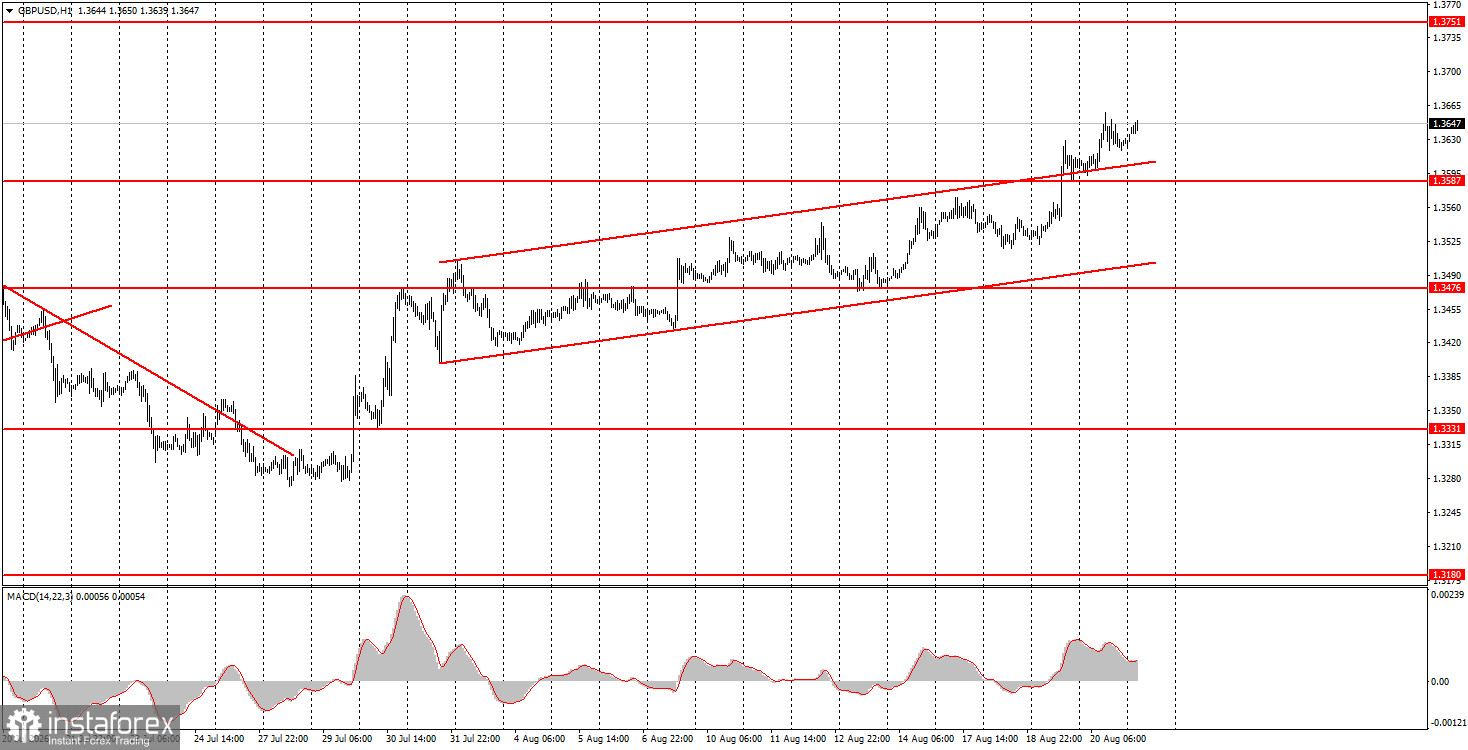
The GBP/USD pair continued its upward movement on Thursday, even surpassing the ascending channel. This indicates that the upward movement is not only stable but also gaining strength over time. This week, the strongest pressure on the dollar came from the US Treasury's decision to double the long-term bond buyback program, which is essentially a quantitative easing (QE) program. QE programs are effectively equivalent to lowering the Federal Reserve's key interest rate. They are aimed at stimulating economic growth or fulfilling other goals. However, for the national currency (the dollar), this always means devaluation. Thus, if previously the list of factors behind the dollar's decline consisted of 6-7 points, one more has now been added. We still anticipate growth in the pair by at least another 100 pips, after which the question of whether to resume the long-term upward trend will arise.
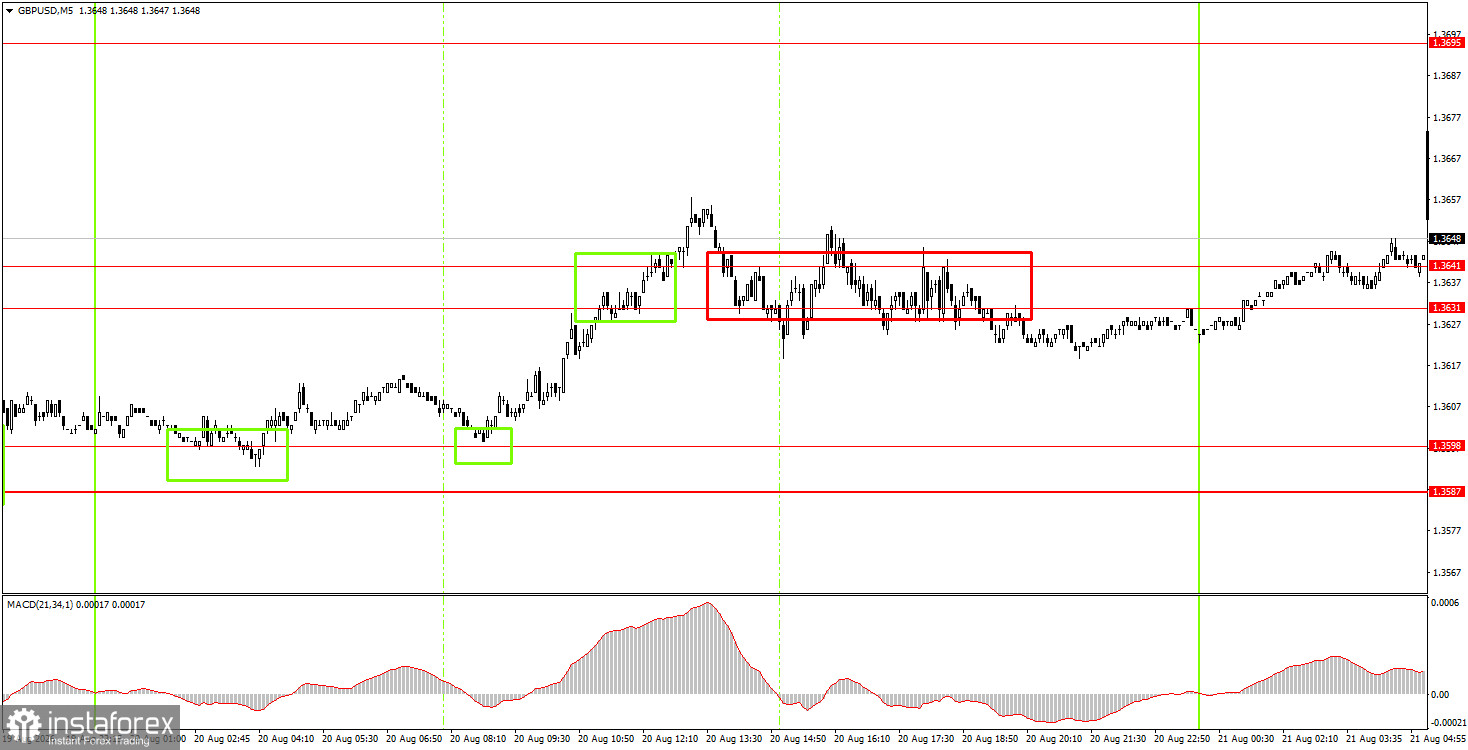
On the 5-minute timeframe, a considerable number of trading signals were formed on Thursday, but most of them are quite challenging to execute. The area of 1.3631-1.3641 did not produce clear signals and will be revisited shortly. Therefore, we can only highlight the first three buy signals, which yielded a few tens of pips in profit.
On the hourly timeframe, the GBP/USD pair maintains its upward trend. In our view, the British pound should continue to rise, even if local factors do not provide support. On the weekly timeframe, the movement from the lower boundary of the sideways channel to the upper one continues and is not yet complete. Market confidence in a Fed rate hike in September is dwindling, as recent macroeconomic data and events are putting pressure on the dollar. Only consolidation below the ascending channel on the hourly timeframe will signal a potential decline in the pair.
On Friday, novice traders can open short positions if the price consolidates below the 1.3631-1.3641 area, targeting 1.3587-1.3598. Long positions can be initiated with a target of 1.3695 if price consolidates above the 1.3631-1.3641 area.
On the 5-minute timeframe, trading can currently take place at the following levels: 1.3259-1.3267, 1.3319-1.3331, 1.3380-1.3386, 1.3456-1.3476, 1.3587-1.3598, 1.3631-1.3641, 1.3695, 1.3741. On Friday, indices of business activity in the services and manufacturing sectors, as well as a report on retail sales, are scheduled for publication in the UK and the US. We recommend paying attention to the British data in the morning, although this week, macroeconomic events are not the primary drivers.
Support and resistance price levels (areas) are the targets when opening buy or sell orders or sources of signals.
Red lines denote channels or trend lines that reflect the current trend and indicate in which direction trading is currently favored.
The MACD indicator (14,22,3) – histogram and signal line – is a supporting indicator that can also be used as a source of signals.
Important speeches and reports (as listed in the news calendar) can significantly influence the movement of the currency pair. Therefore, during their release, trading should be approached with utmost caution, or one should exit the market to avoid sharp price reversals against the preceding movement.
Beginners in Forex trading should remember that not every trade can be profitable. Developing a clear strategy and proper money management are essential for long-term trading success.
Le recensioni analitiche di InstaForex ti renderanno pienamente consapevole delle tendenze del mercato! Essendo un cliente InstaForex, ti viene fornito un gran numero di servizi gratuiti per il trading efficiente.


