 Rimani
Condizioni di trading
Strumenti



August is traditionally considered one of Bitcoin's least favorable months, and this year's result makes it an exception that could rank among the best in the asset's trading history.

Since 2013, Bitcoin's average return in August has been a modest 1.12%, while the median has actually been negative, at about -7.49%, because a typical August more often closes in the red and the positive average is pulled higher only by a few exceptional rallies. Of the last 13 Augusts, only 4 were positive, and the absolute record remains August 2017, when Bitcoin gained 65.32%. Against that backdrop, August 2026's 25.3% rise puts it among the few genuinely strong months in the asset's history rather than a routine summer rebound.
It is also important to note that this was the second consecutive month of gains after July's 7.4%, which means bitcoin has fully recovered the March-to-June correction, and average losses for the year no longer look so critical.
Ether delivered an even more impressive performance, rising more than 32% over the month and climbing from levels below $1,950 to a $2,400–$2,480 range.
The catalysts behind the two-month rally are clearly visible in the sequence of events discussed here over recent weeks. The US Treasury's decision on August 19 to double long-term bond buybacks triggered a sharp jump in prices and more than $3 billion in short liquidations; Trump's meeting with crypto industry representatives at the White House added regulatory optimism; and a series of strong weekly inflows into spot ETFs, including a record $1.92 billion in a single week, provided institutional confirmation of the move.
The result for the largest corporate holders is also notable. Michael Saylor's strategy ended August with an unrealized gain of more than $2.8 billion on its reserve of 840,447 Bitcoin, returning to profit for the first time in several months thanks to this rally — rare for August — which had only days earlier been interrupted by a sharp pullback after Warsh's hawkish Jackson Hole speech but still failed to overturn the overall monthly result.
Trading recommendations:
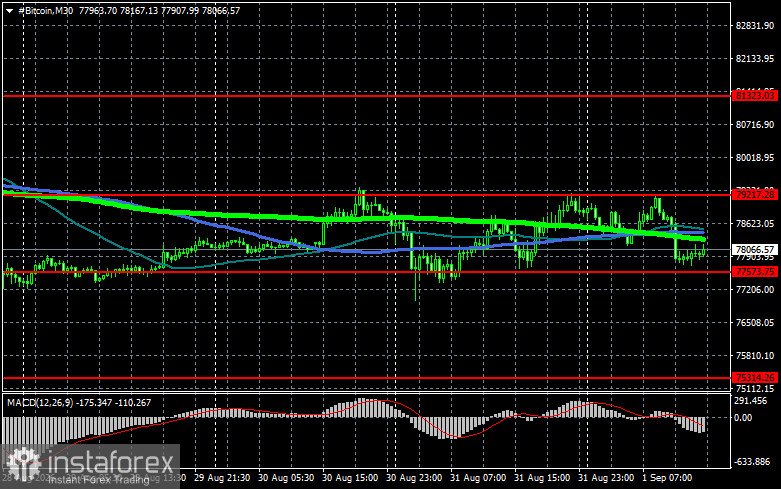
As for the technical picture for Bitcoin, buyers are now targeting a return to $79,200, which opens a direct path to $81,300, and from there the distance to $83,600 is short; a break of that level will signal an attempt to restore a bull market. In the event of a decline in bitcoin, I expect buyers at $77,500. A move back below that area can quickly drag BTC toward $75,300. The farthest target will be the $72,800 area.
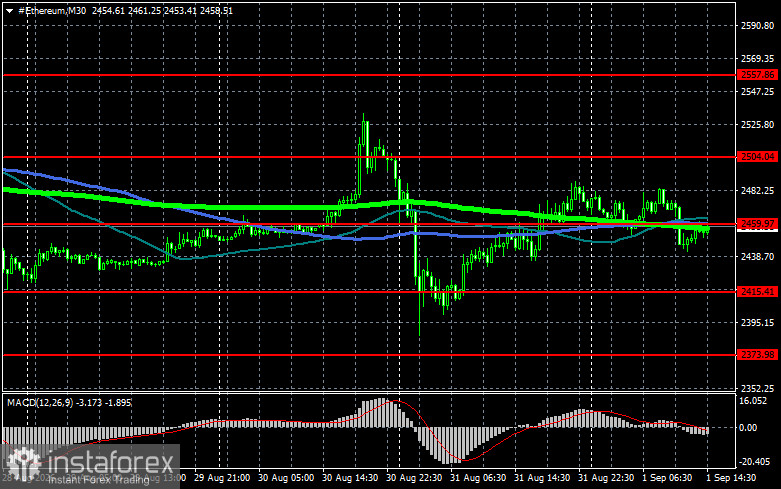
As for the technical picture for Ethereum, a clear hold above $2,504 opens a direct path to $2,557. The farthest target will be the high around $2,624, a break of which will signal strengthening bullish sentiment and a return of buyer interest. In the event of a decline in ether, I expect buyers at $2,459. A move back below that area can quickly drag ETH toward $2,415. The farthest target will be the $2,373 area.
What we see on the chart:
- Red lines indicate support and resistance levels where either a price slowdown or active growth is expected;
- Green lines indicate the 50-day moving average;
- Blue lines indicate the 100-day moving average;
- Light green lines indicate the 200-day moving average.
A crossover, or a price test of moving averages, typically either halts the move or sparks fresh market momentum.
Le recensioni analitiche di InstaForex ti renderanno pienamente consapevole delle tendenze del mercato! Essendo un cliente InstaForex, ti viene fornito un gran numero di servizi gratuiti per il trading efficiente.


