 Rimani

Condizioni di trading
Strumenti


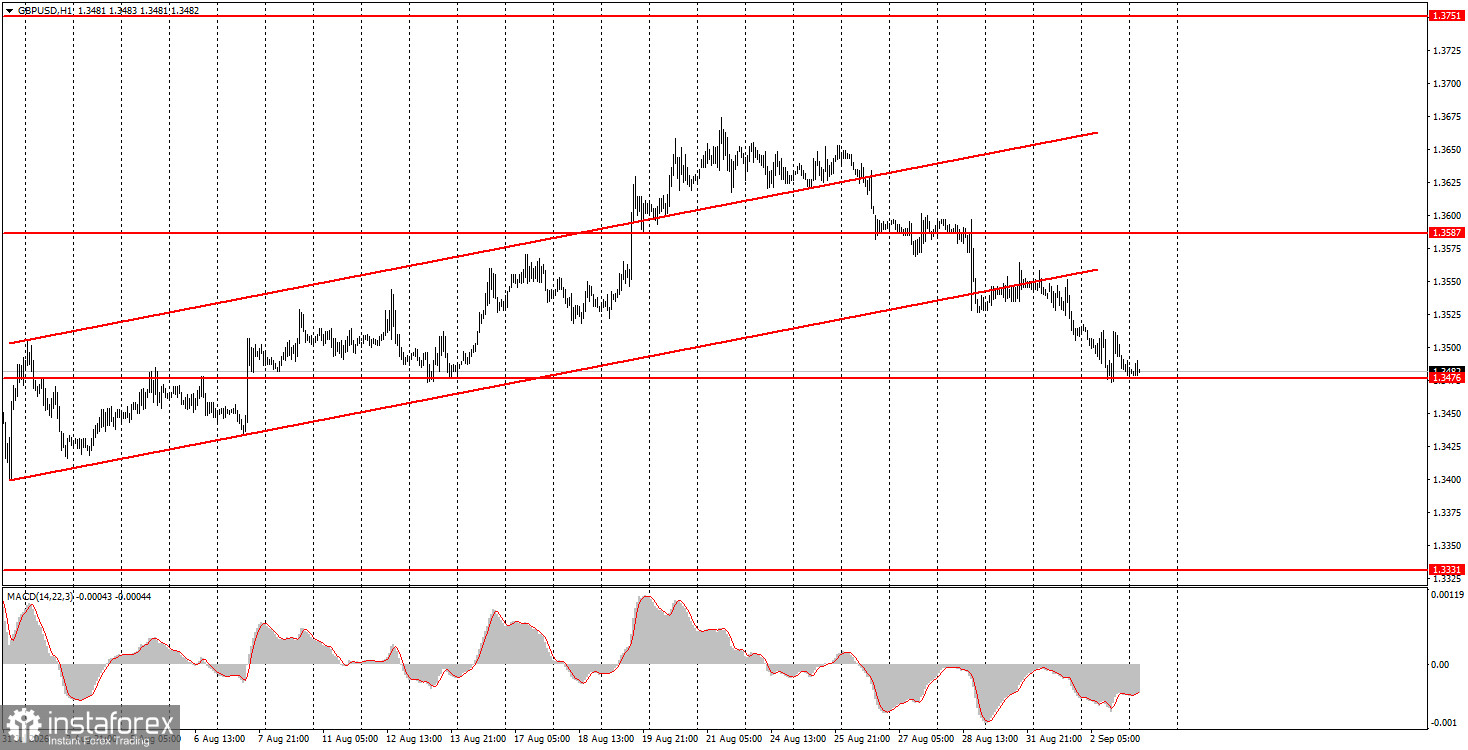
The GBP/USD pair continued its downward movement on Wednesday, although there were few reasons for this beyond technical factors. A few days ago, the price left the ascending channel, so the pound may continue to fall on technical grounds. However, there is no real fundamental or macroeconomic support for the dollar. One could argue that geopolitics in the Middle East has worsened again and that Kevin Warsh once more spoke about high inflation in the U.S., which increases the dollar's appeal as a safe-haven asset and raises the probability of Federal Reserve tightening. We believe, however, that this is not entirely the case. The current state of the U.S. labor market does not, in our view, justify a rate hike, and Warsh has been talking about high inflation all summer, yet the Fed has not taken hawkish steps. Yesterday only one report was published — the ADP employment report — and, as has been typical this week, it came in weaker than forecasts and could not have driven dollar strength. Nevertheless, the American currency is still retracing gains.
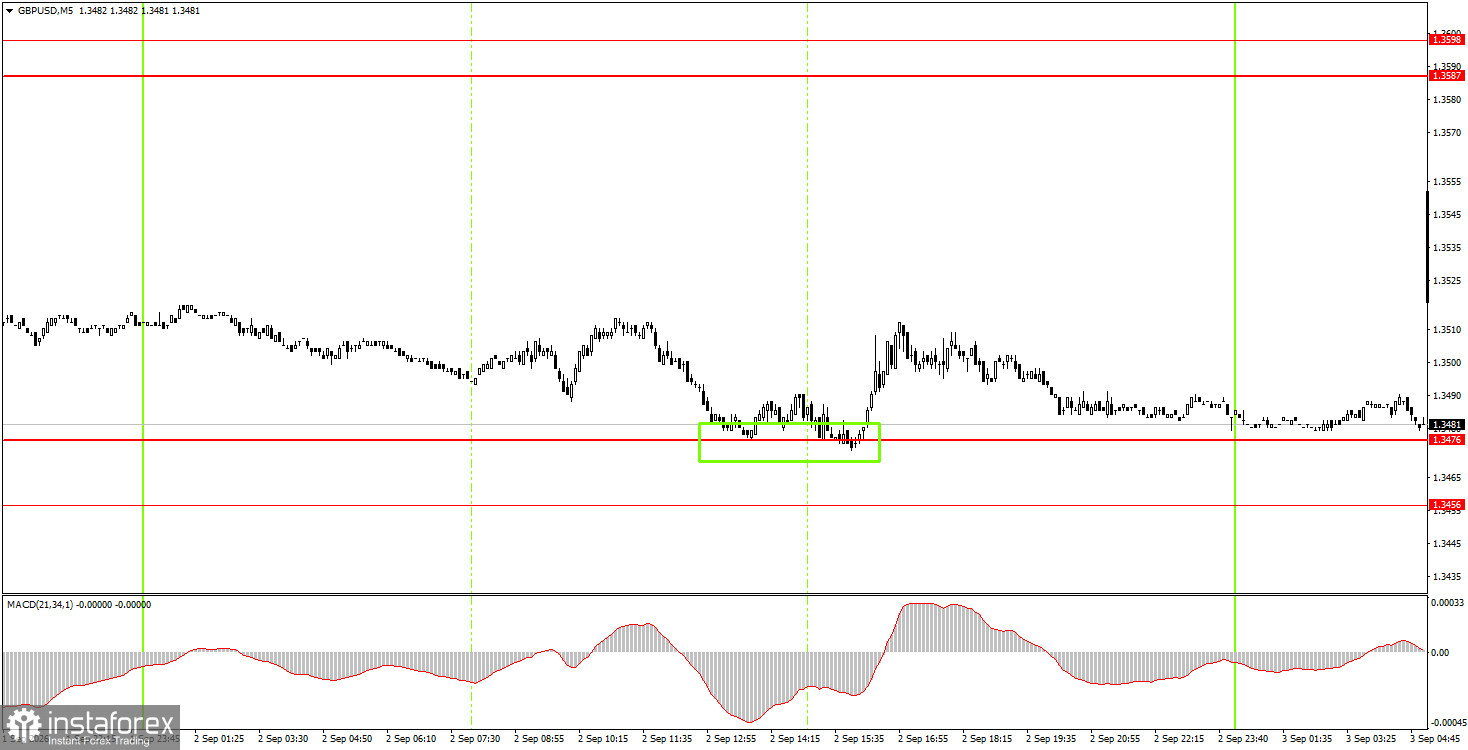
On the 5-minute timeframe on Wednesday, one buy signal was formed. At the start of the U.S. session, the price bounced from the 1.3456–1.3476 area, allowing novice traders to open long positions. The pound failed to extend the upward move, but another bounce from that area may occur today.
On the hourly timeframe, GBP/USD remains in a downward corrective trend. In our view, the pound should continue to rise in the medium term, but it is currently in correction. On the weekly timeframe, the move from the lower bound of the sideways channel toward the upper bound continues, and that movement may not yet be complete. Friday improved sentiment for the U.S. currency, but that support is unlikely to last.
On Thursday, novice traders may consider short positions targeting 1.3380–1.3386 if price consolidates below the 1.3456–1.3476 area. Long positions can be opened targeting 1.3587–1.3598 if the price bounces from the 1.3456–1.3476 area.
On the 5-minute timeframe, consider trading the following levels: 1.3259–1.3267, 1.3319–1.3331, 1.3380–1.3386, 1.3456–1.3476, 1.3587–1.3598, 1.3631–1.3641, 1.3695, 1.3741. On Thursday, the UK will publish the second-estimate services PMI for August (a secondary release). In the U.S., the ISM services index — a fairly important report — will be released.
Price levels (areas) of support and resistance are levels that serve as targets when opening buy or sell trades, or as sources of signals.
Red lines indicate channels or trend lines that illustrate the current trend and show the preferred direction for trading.
The MACD indicator (14,22,3) — the histogram and signal line — is an auxiliary indicator that can also be used as a source of signals.
Important speeches and reports (contained in the news calendar) can significantly influence the movement of currency pairs. Therefore, during their release, trading should be approached with utmost caution, or traders should exit the market to avoid sudden reversals against the preceding movement.
Beginner forex traders should remember that not every trade can be profitable. Developing a clear strategy and practicing money management are key to long-term success in trading.
Le recensioni analitiche di InstaForex ti renderanno pienamente consapevole delle tendenze del mercato! Essendo un cliente InstaForex, ti viene fornito un gran numero di servizi gratuiti per il trading efficiente.


