 Rimani

Condizioni di trading
Strumenti


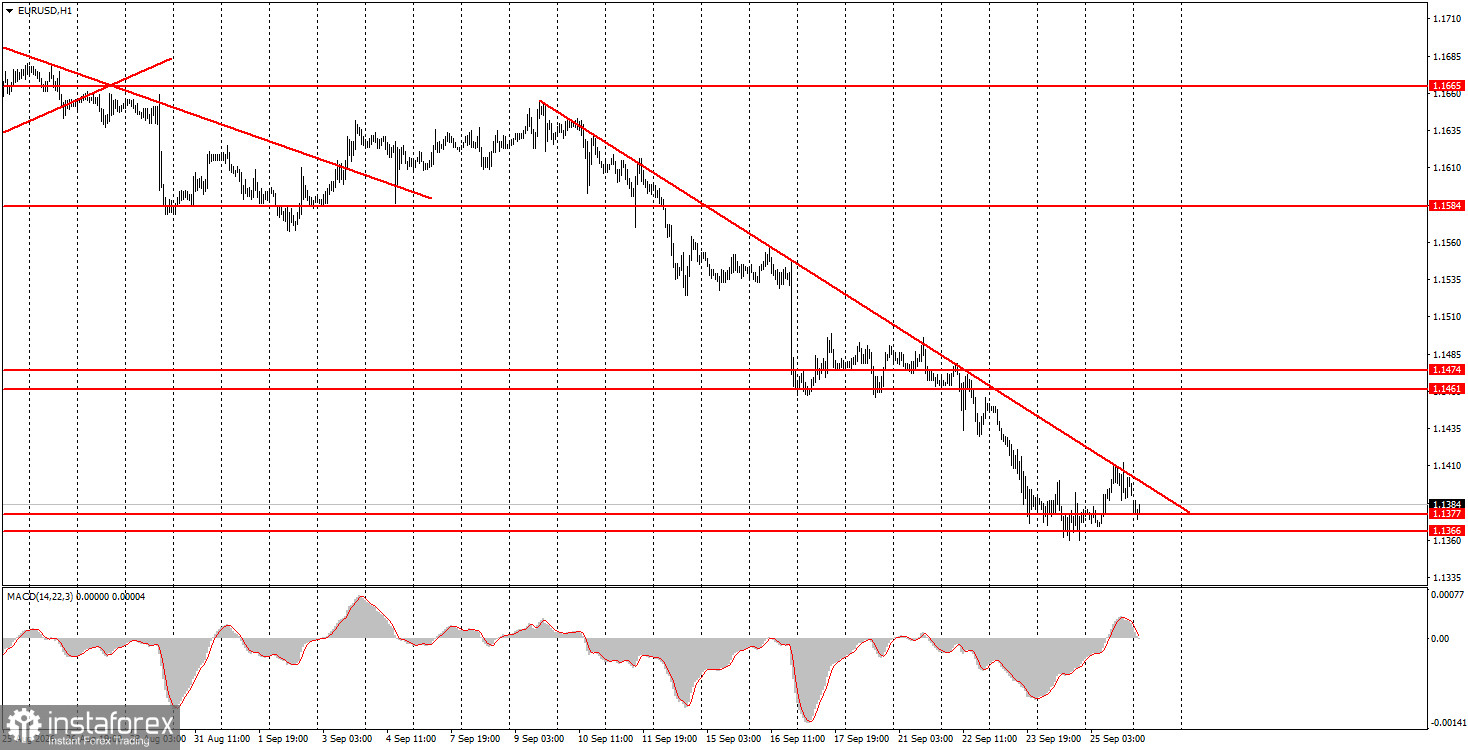
The EUR/USD pair on Friday tried to correct slightly again but immediately ran into the descending trend line, which lay—and still lies—quite close to price. Thus the latest attempt to correct failed. The US dollar has been rising for three full weeks, and analysts continue to point to a tightening of Federal Reserve views as the main reason for the dollar's strength. We have already said that the market cannot price the same economic factor for three weeks straight, so the problem is unlikely to be the Fed's rate hikes alone. Most likely we are dealing with an inertial, purely technical move. The dollar rises because it is being bought, and it is bought because it rises. As banal as it sounds, that appears to be the case. It is also worth noting intensified geopolitical tension in Eastern Europe in recent weeks. The world expects—or at least does not rule out—an expansion of the conflict in Ukraine, which may again force capital to flee risky territories. Capital flees primarily to the dollar.
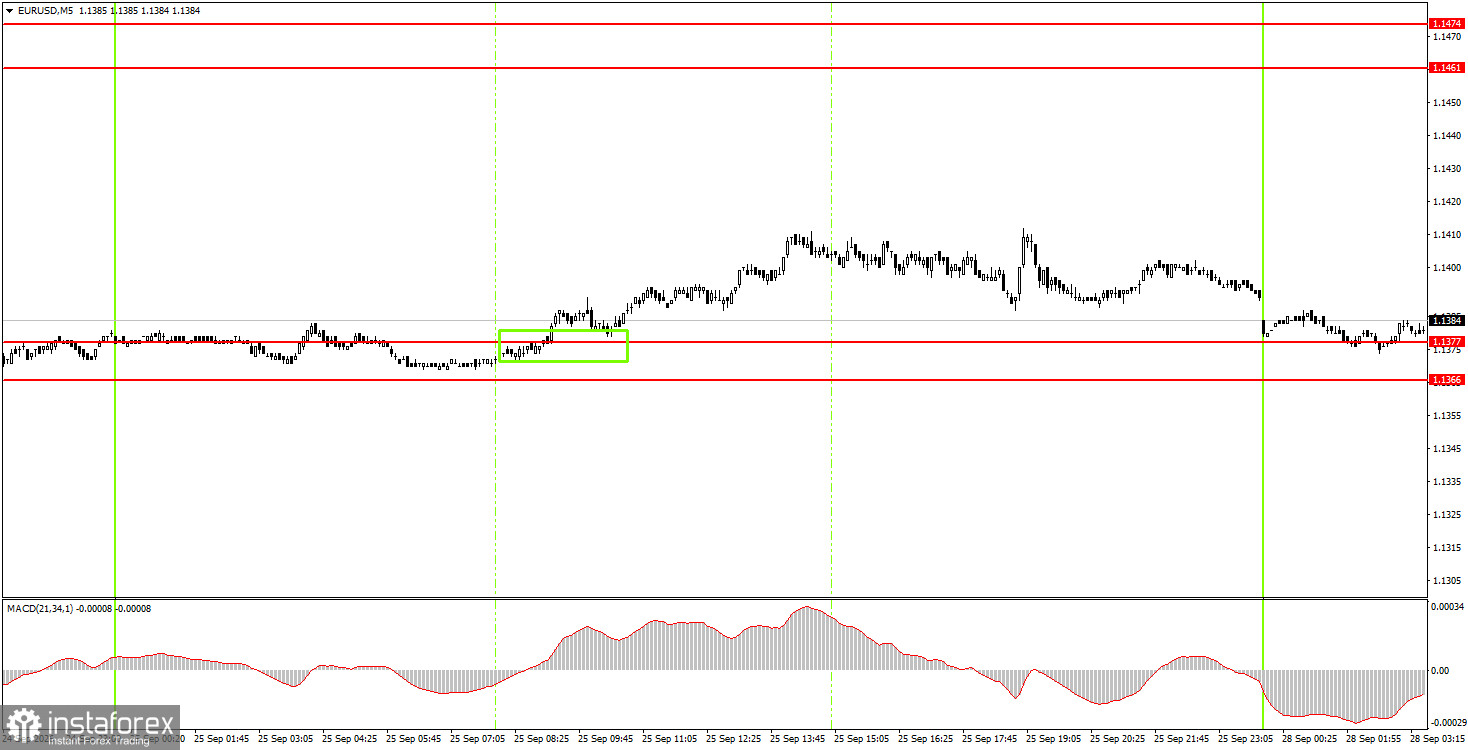
On the 5-minute TF on Friday, one buy signal was formed. At the start of the European session, the price bounced from the 1.1366–1.1377 area, allowing it to rise about 25 pips during the day. Market volatility remains quite low, so profits from any single signal are modest.
On the hourly timeframe, the EUR/USD pair continues a downward tendency that is now a full-fledged trend. Considering events from recent months, we do not believe the euro should be plunging like a stone. But for the market, the Fed's monetary policy remains the top priority and has become much more favorable to the US currency. The market ignores other factors.
On Monday novice traders can open short positions with a target of 1.1267–1.1275 if price consolidates below the 1.1366–1.1377 area. Open long positions with a target of 1.1461–1.1474 if price rebounds from the 1.1366–1.1377 area.
On the 5-minute TF consider the levels 1.1267–1.1275, 1.1366–1.1377, 1.1461–1.1474, 1.1527–1.1531, 1.1584–1.1594, 1.1655–1.1665, 1.1745–1.1754. No important or interesting events are scheduled in the US or the EU on Monday, so traders will have nothing to react to during the day. Most likely we face another "boring Monday," which will then flow into a "boring Tuesday."
Price levels (areas) of support and resistance serve as targets for opening buy or sell trades or as sources of signals.
Red lines indicate channels or trend lines that show the current trend and the preferred trading direction.
The MACD indicator (14,22,3) — the histogram and signal line — is an auxiliary indicator that can also provide signals.
Important speeches and reports (listed in the news calendar) can significantly influence currency pair movements. Therefore, during their release, traders should approach trading with utmost caution, or exit the market to avoid sudden reversals against the preceding move.
Beginner forex traders should remember that not every trade can be profitable. Developing a clear strategy and practicing money management are key to long-term success in trading.
Le recensioni analitiche di InstaForex ti renderanno pienamente consapevole delle tendenze del mercato! Essendo un cliente InstaForex, ti viene fornito un gran numero di servizi gratuiti per il trading efficiente.


