 Rimani

Condizioni di trading
Strumenti


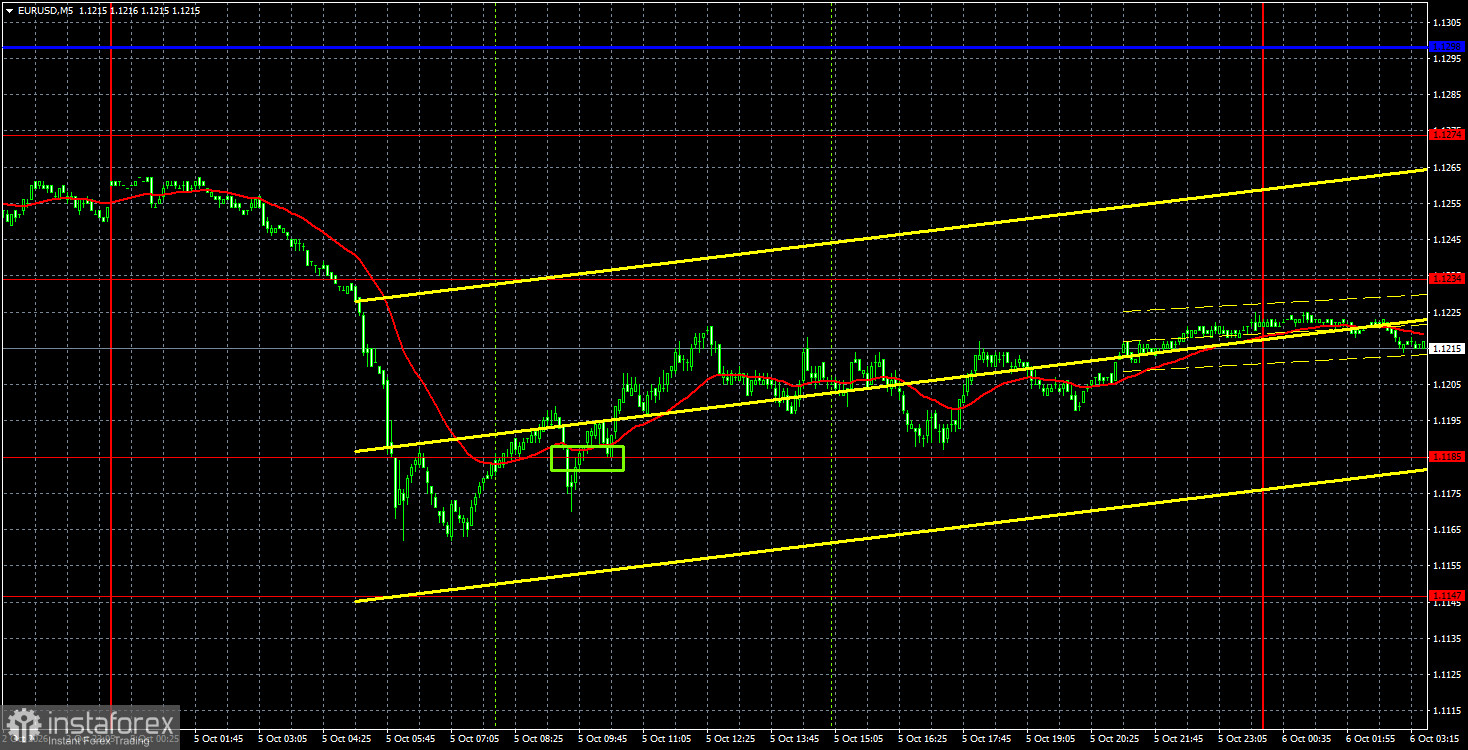
The EUR/USD currency pair again showed a fairly strong decline on Monday. Moreover, that decline occurred before the European trading session opened, and during the European and American sessions the pair could only retrace a little. Thus, despite a decent intraday rise for much of the day, the euro remains effectively in a collapsing downtrend. Yesterday the euro's new fall and the dollar's rise were triggered by two new events. First, the Yemeni government officially declared war on the Shiite Houthi movement. Since Yemen and Houthi-held territories lie near the Bab el-Mandeb strait, risks of a blockade of this second oil artery from the Middle East immediately emerged, prompting a flight of capital into the safe-haven dollar. Second, unrest continues in France, and a budget problem has been added. The French government will have to close the "hole" in its budget by raising taxes or cutting spending — most likely both — which angers citizens and prompts investors to move away from the country's bonds, given a government that cannot balance its books. We still believe the reasons for EUR/USD's decline over the past month are different, but we cannot ignore that the events above could have contributed to dollar strength.
Technically, the formation of the downtrend continues. The market has been buying the dollar for the fourth week in a row. The trendline remains relevant, and price sits below the Ichimoku indicator lines, so the pair's decline is technically consistent.
On the 5-minute TF on Monday, one buy signal was generated. However, moves in the first half of the day were choppy, and price ignored technical levels under the influence of fundamental and geopolitical drivers. As a result, the signal was imprecise.
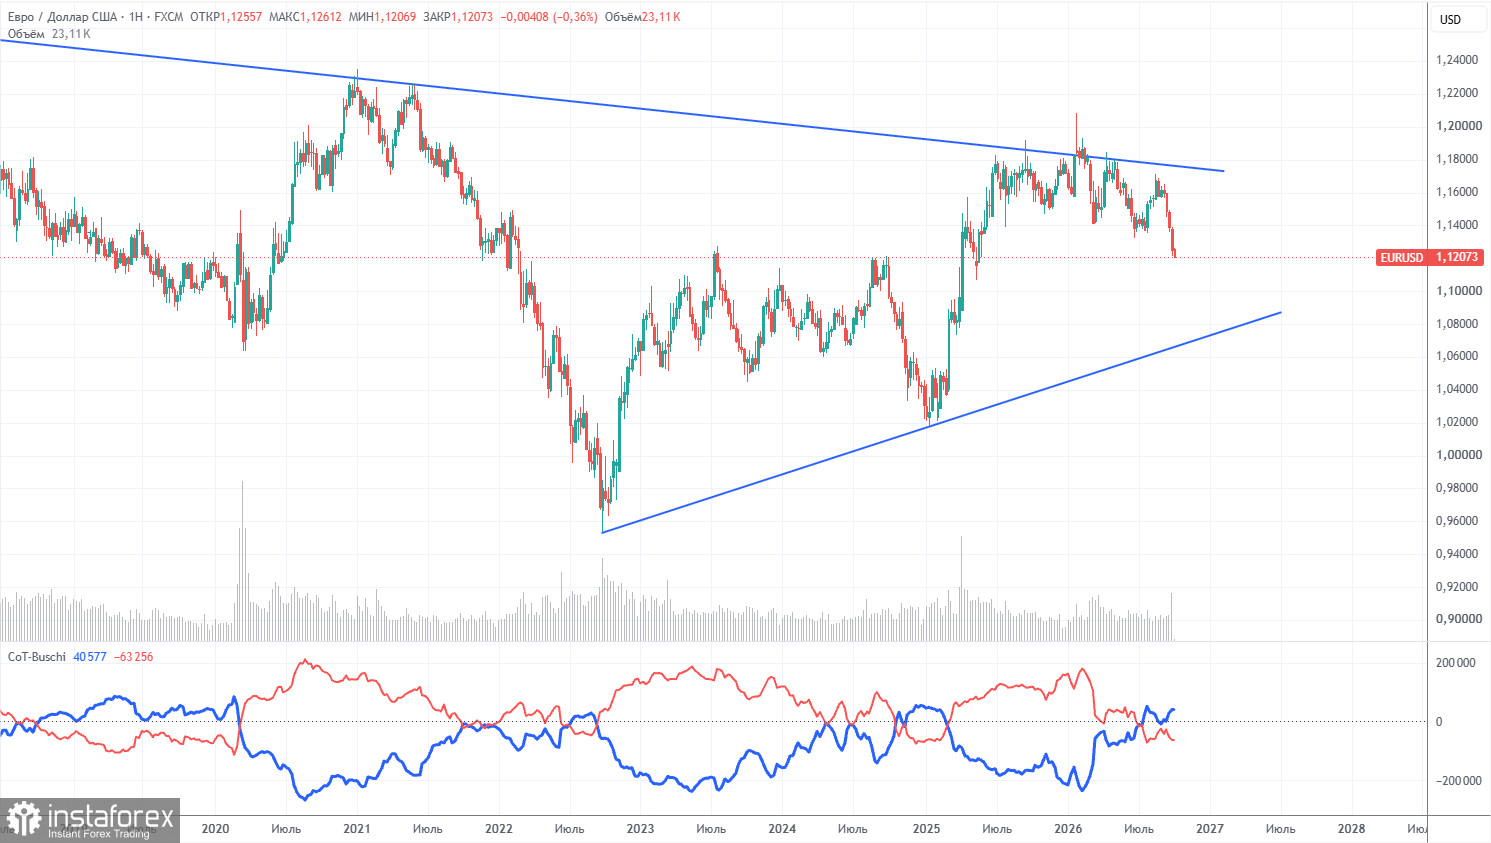
The latest COT report is dated September 29. On the weekly TF chart, non-commercial traders' net position remains "bearish" and fell significantly in 2026 due to geopolitical events. Traders have been shedding the euro in favor of the US dollar over the past six months. Donald Trump's policies have not changed, but the dollar has, for a time, acted as a "reserve currency."
However, we still do not see any fundamental factors for further strengthening of the US currency. The war in the Middle East made the dollar temporarily super-attractive, and the Federal Reserve's monetary stance surprised the dollar for the second time this year. In the long term, the euro could fall even to $1.08 (the trendline), but the uptrend will remain relevant. However, in recent weeks the market has accounted only for factors positive to the dollar and ignored all others.
The arrangement of the red and blue indicator lines points to an approximate parity between bulls and bears. During the last reporting week, longs in the "Non-commercial" group rose by 17,500, while short positions rose by 28,400. Accordingly, the net position for the week decreased by 10,900 contracts.
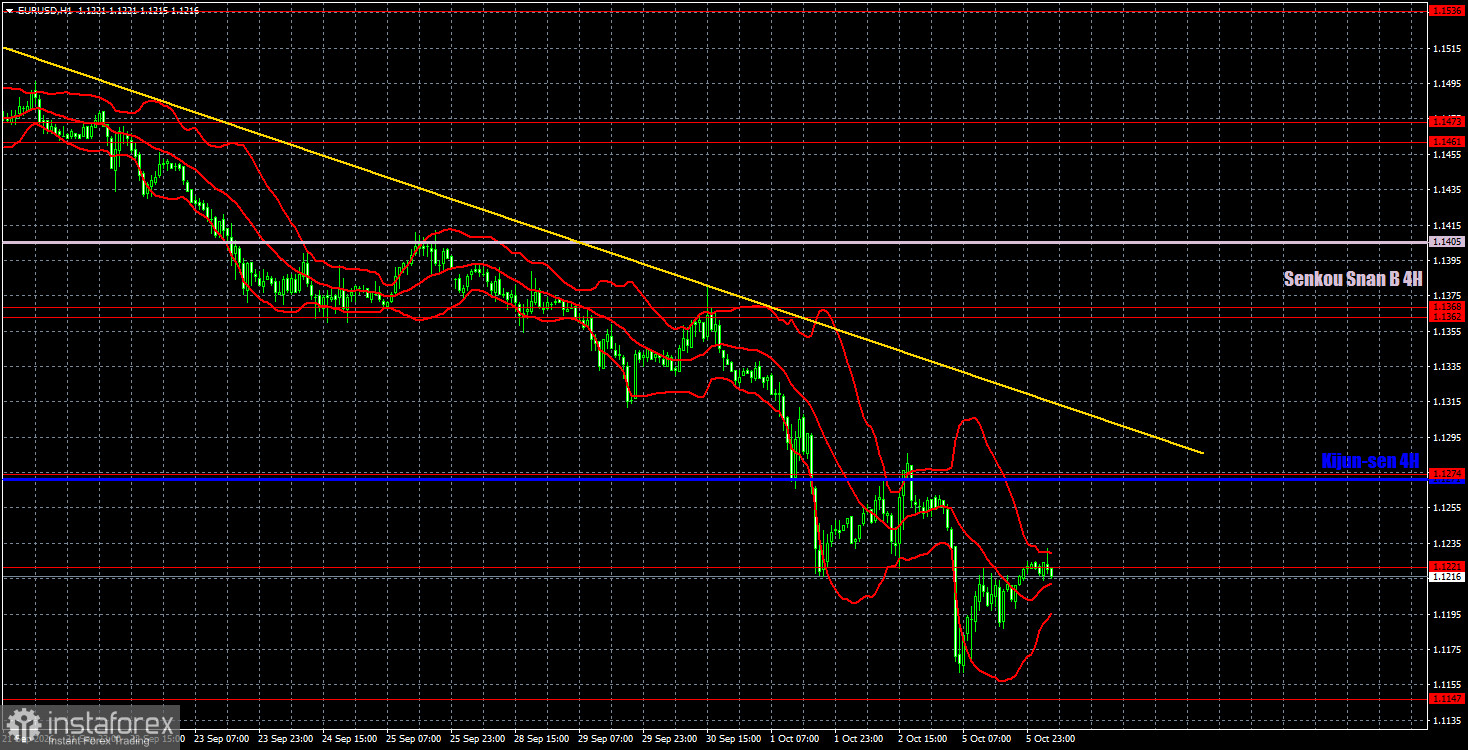
On the hourly timeframe, EUR/USD continues to form a downward trend, and the Federal Reserve helped drive the downward move, though this factor is unlikely to be the reason for the dollar's rise at present. The European Central Bank should have supported the euro, having already raised rates twice in 2026, and Friday's US data should have triggered a dollar collapse. But the market now sees no factors supporting the euro. Thus, the dollar continues forming a strong trend that now depends only on market sentiment.
For October 6 we highlight the following levels for trading — 1.1092, 1.1147, 1.1221, 1.1274, 1.1362–1.1368, 1.1461–1.1473, 1.1536–1.1542, 1.1585, 1.1657–1.1665, and also the Senkou Span B line (1.1405) and Kijun-sen (1.1270). The Ichimoku indicator lines may shift during the day, so account for this when determining trading signals. Don't forget to move Stop Loss to breakeven if the price has moved 15 pips in the correct direction. This will protect against possible losses if the signal turns out to be false.
On Tuesday the Eurozone will publish retail-sales data, and the US will release the weekly ADP report, which is of almost no significance. In theory, a small market reaction may follow the European report, but for about a month now the market has been trading by its own rules and macroeconomic data have had virtually no effect.
Traders can consider short positions near 1.1147 and 1.1092 if price rebounds from 1.1221. If the trendline is breached, consider long positions at 1.1362–1.1368 and 1.1405.
Le recensioni analitiche di InstaForex ti renderanno pienamente consapevole delle tendenze del mercato! Essendo un cliente InstaForex, ti viene fornito un gran numero di servizi gratuiti per il trading efficiente.


