 Rimani

Condizioni di trading
Strumenti


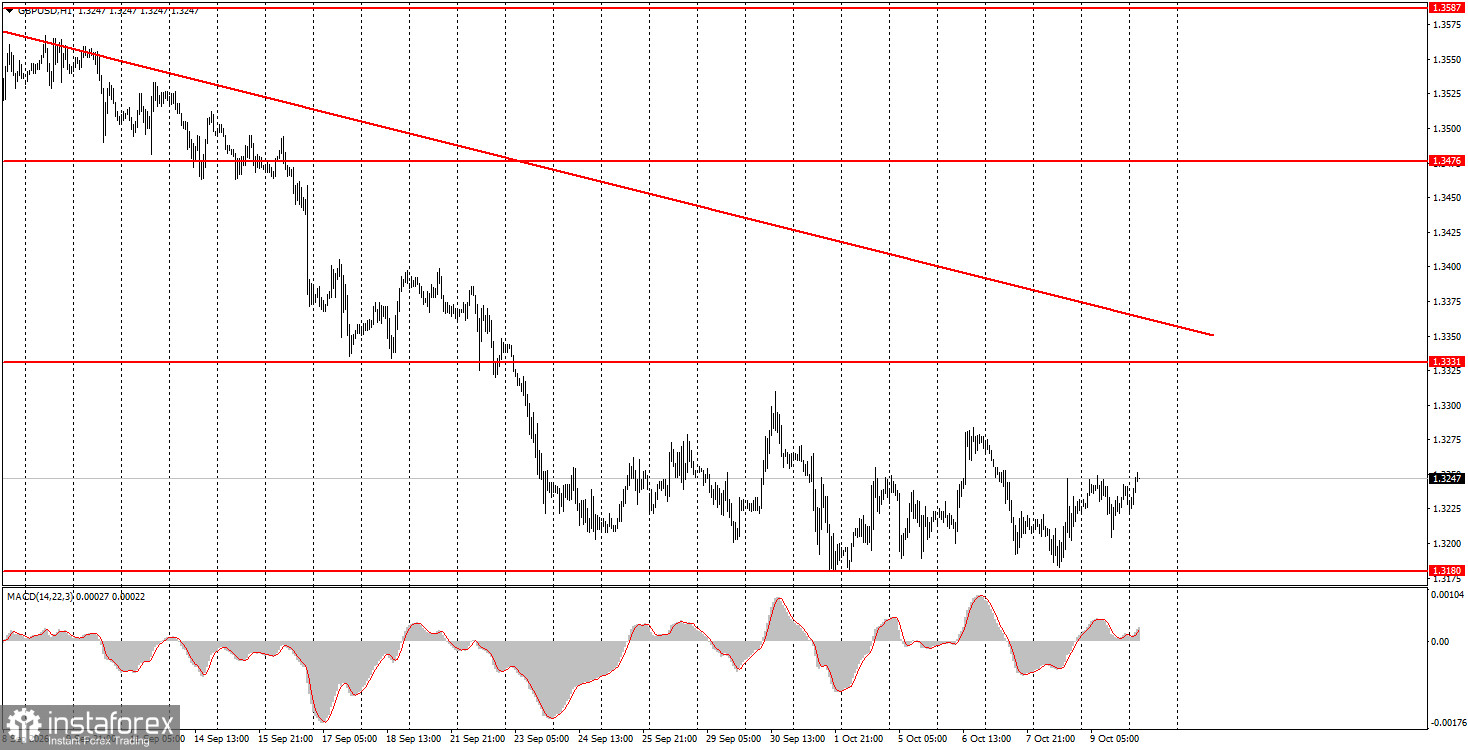
The GBP/USD pair continued to trade in a sideways channel on Friday, one of the three we have discussed recently. On the hourly timeframe the price has been flat for more than two weeks, which is very good for the British currency, since showing growth even when factors and reasons for it exist is now an arduous task. Thus, even a small rise in the pound is already a celebration. The absence of a new decline is a banquet. No major events occurred on the last trading day in either the US or the UK. The US consumer sentiment index came in weaker than forecasts but did not trigger a significant dollar fall. Recall that the market has recently ignored almost all events that are not in favor of the dollar. In our view, the key point for the pound now remains the triple sideways channel on the weekly, daily, and hourly timeframes. Price is in the lower area of all three channels, so the chances of a reversal and a fairly strong rise in the pound remain high.
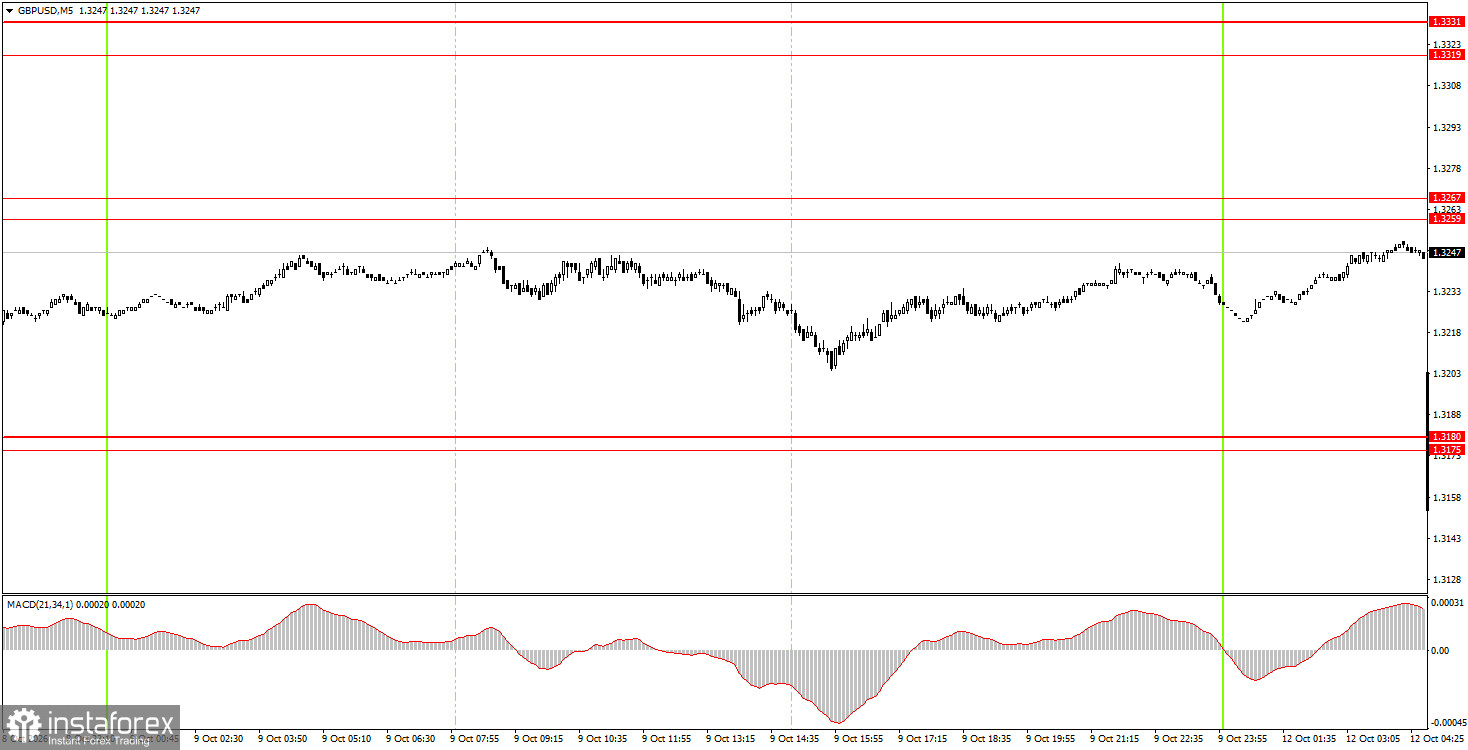
On the 5-minute timeframe, no trading signals formed on Friday, as price failed to hold any level or area during the day. Therefore, novice traders had no grounds to enter the market.
On the hourly timeframe, GBP/USD continues a downward tendency that has become a full, powerful trend. The fundamental backdrop for the dollar improved after the Federal Reserve signaled readiness to begin tightening monetary policy. However, three weeks have passed, and the market continues to buy the dollar "with both hands." Therefore, we strongly doubt that Fed monetary policy alone is the driver. We consider the current movement illogical, inertia-driven, and speculative.
On Monday, novice traders may consider short positions targeting 1.3175–1.3180 if price rebounds from the 1.3259–1.3267 area. Open long positions with a target of 1.3319–1.3331 if price breaks above the 1.3259–1.3267 area.
On the 5-minute timeframe, traders can use the levels 1.3043, 1.3096–1.3107, 1.3175–1.3180, 1.3259–1.3267, 1.3319–1.3331, 1.3380–1.3386, 1.3456–1.3476, 1.3587–1.3598, 1.3631–1.3641. On Monday, no major events are scheduled in the UK or the US, so traders will have nothing to react to during the day. We don't expect high volatility today, and the pound may try to recover a little further.
Price levels (areas) of support and resistance serve as targets for opening buy or sell trades or as sources of signals.
Red lines indicate channels or trend lines that show the current trend and the preferred trading direction.
The MACD indicator (14,22,3) — the histogram and signal line — is an auxiliary indicator that can also provide signals.
Important speeches and reports (listed in the news calendar) can significantly influence currency pair movements. Therefore, during their release, traders should approach trading with utmost caution, or exit the market to avoid sudden reversals against the preceding move.
Beginner forex traders should remember that not every trade can be profitable. Developing a clear strategy and practicing money management are key to long-term success in trading.
Le recensioni analitiche di InstaForex ti renderanno pienamente consapevole delle tendenze del mercato! Essendo un cliente InstaForex, ti viene fornito un gran numero di servizi gratuiti per il trading efficiente.


