 Rimani
Condizioni di trading
Strumenti



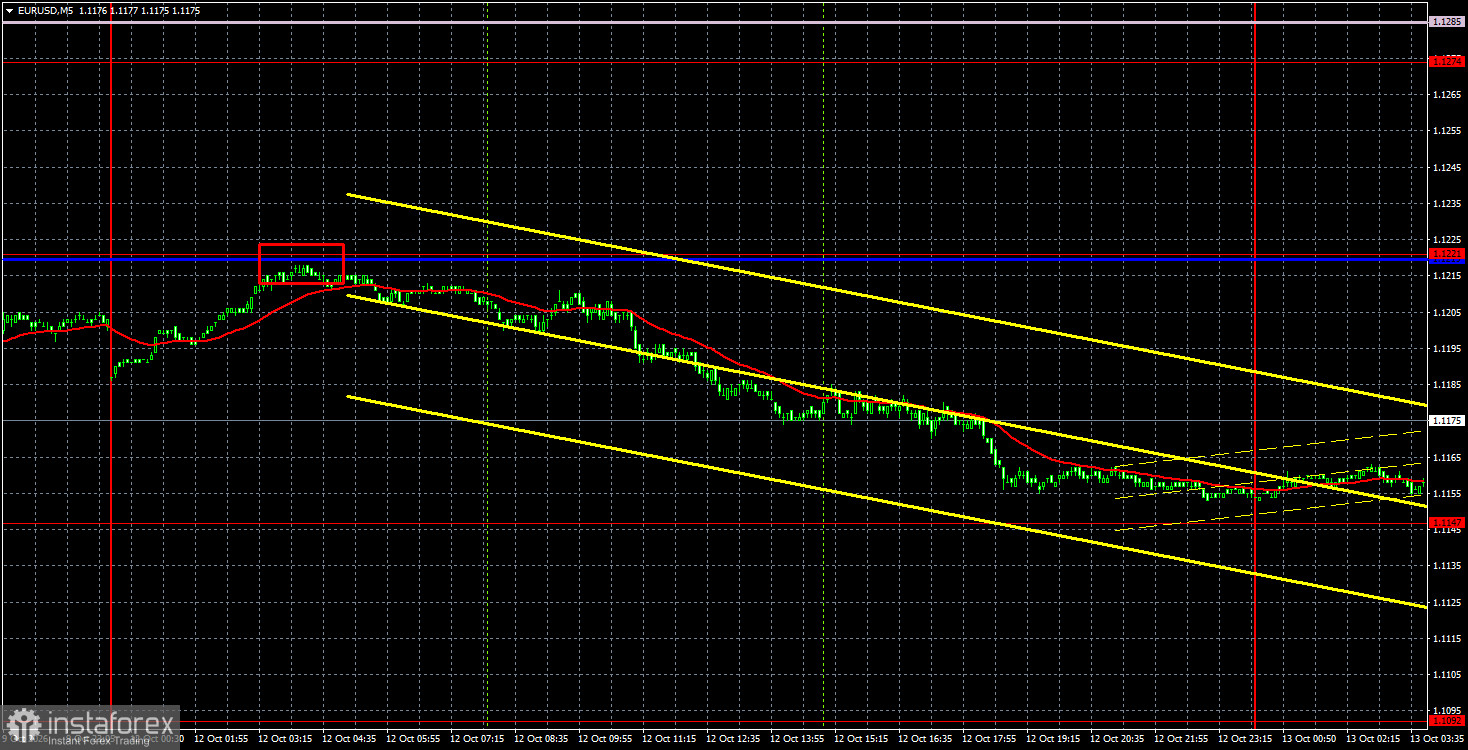
The EUR/USD currency pair resumed its decline on Monday after a week-long pause. The market had no new, weighty reasons to keep selling EUR/USD, and no major news emerged during the first trading day of the week. Yesterday the possible energy truce between Ukraine and Russia — which could be a first step toward ending the conflict — was actively discussed worldwide. However, it became clear that if a truce is reached, it will result from long, complex negotiations between Kyiv and Moscow, not at the behest of Donald Trump. Incidentally, on Monday the US president even said the parties had violated the terms of the energy truce, and only Trump knows what those terms were. Thus, the conflict between Ukraine and Russia remained where it was before Monday. It is therefore unlikely the dollar rose on the basis that the confrontation in Eastern Europe has lasted five years. No other important topics, statements, or publications emerged during the day. The euro's inertia-driven and speculative decline continues.
Technically, the downtrend continues to form. The market has been buying the dollar for the fifth consecutive week. The trendline remains relevant; price sits below the Ichimoku lines, so the pair's decline is fully logical from a technical point of view. Expecting euro recovery makes sense only after the trendline is breached.
On the 5-minute timeframe, one sell trading signal was formed on Monday. During the Asian session, price rebounded from the 1.1220–1.1221 area with a small margin, and by the start of the European session price had moved only a short distance from the signal formation point, allowing traders to open short positions. By the end of the day, the pair fell nearly to 1.1147, so short positions could be closed safely with a good profit.
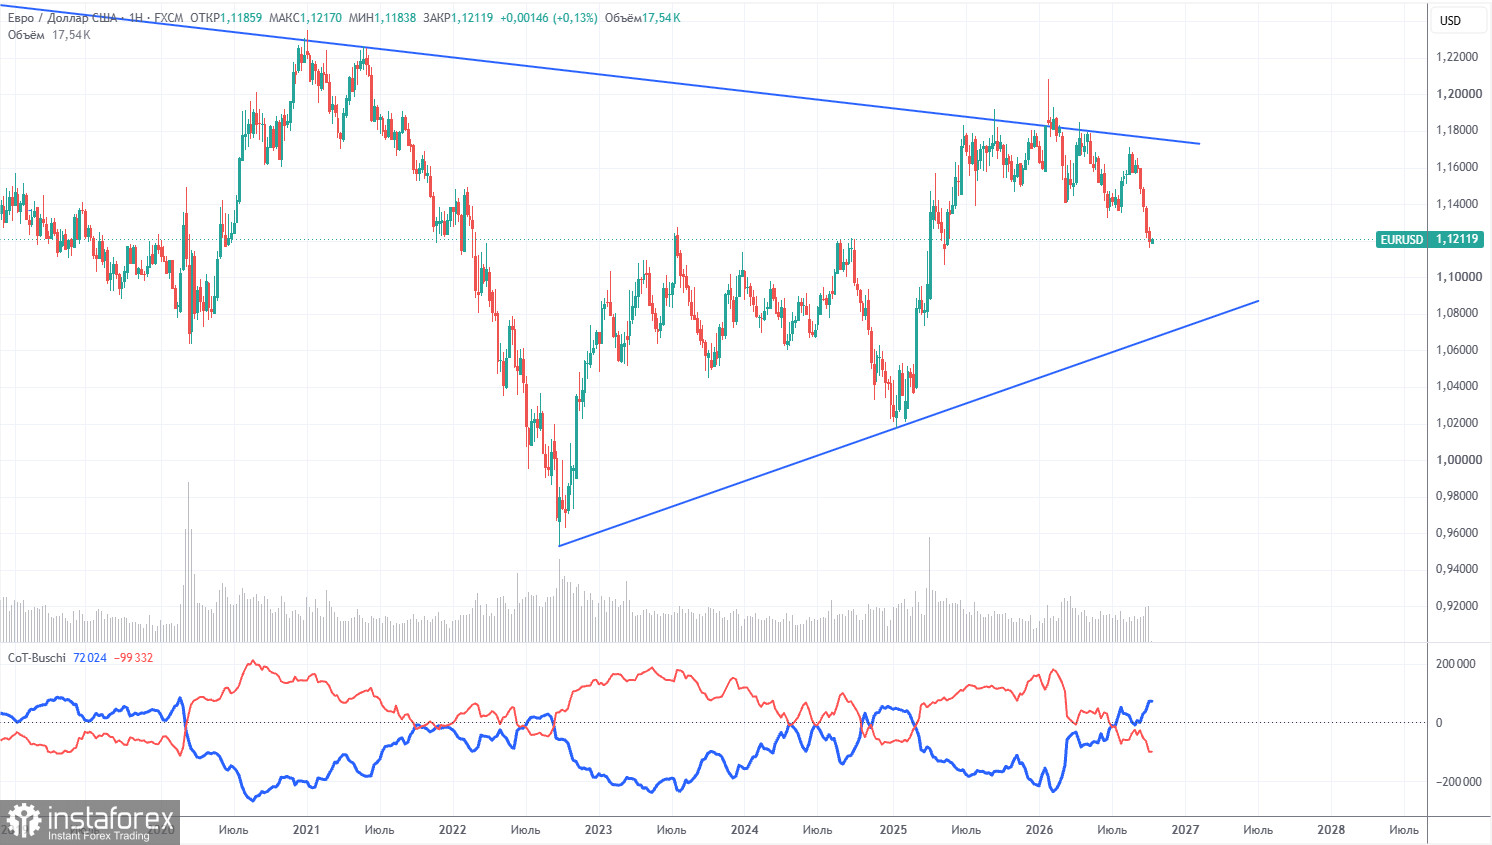
The latest COT report is dated October 6. The weekly timeframe illustration clearly shows that the net position of non-commercial traders remains "bearish" and has declined significantly in 2026 due to geopolitical events. Traders have been reducing euro exposure in favor of the US dollar over the past six months. Trump's policies have not changed, but the dollar has long served as a "reserve" currency.
However, we still do not see any fundamental factors that would further strengthen the US currency. The war in the Middle East made the dollar temporarily super-attractive, and the Federal Reserve's monetary policy stance surprised the dollar for the second time this year. In the long term, the euro could fall as low as $1.08 (the trendline), but the uptrend will remain relevant. Yet in recent weeks the market accounts only for positive factors for the dollar and ignores everything else.
The positioning of the red and blue indicator lines points to an approximate parity between bulls and bears. During the last reporting week, long positions in the "Non-commercial" group increased by 4,800, while shorts rose by 40,900. Accordingly, the net position decreased further by 36,100 contracts over the week.
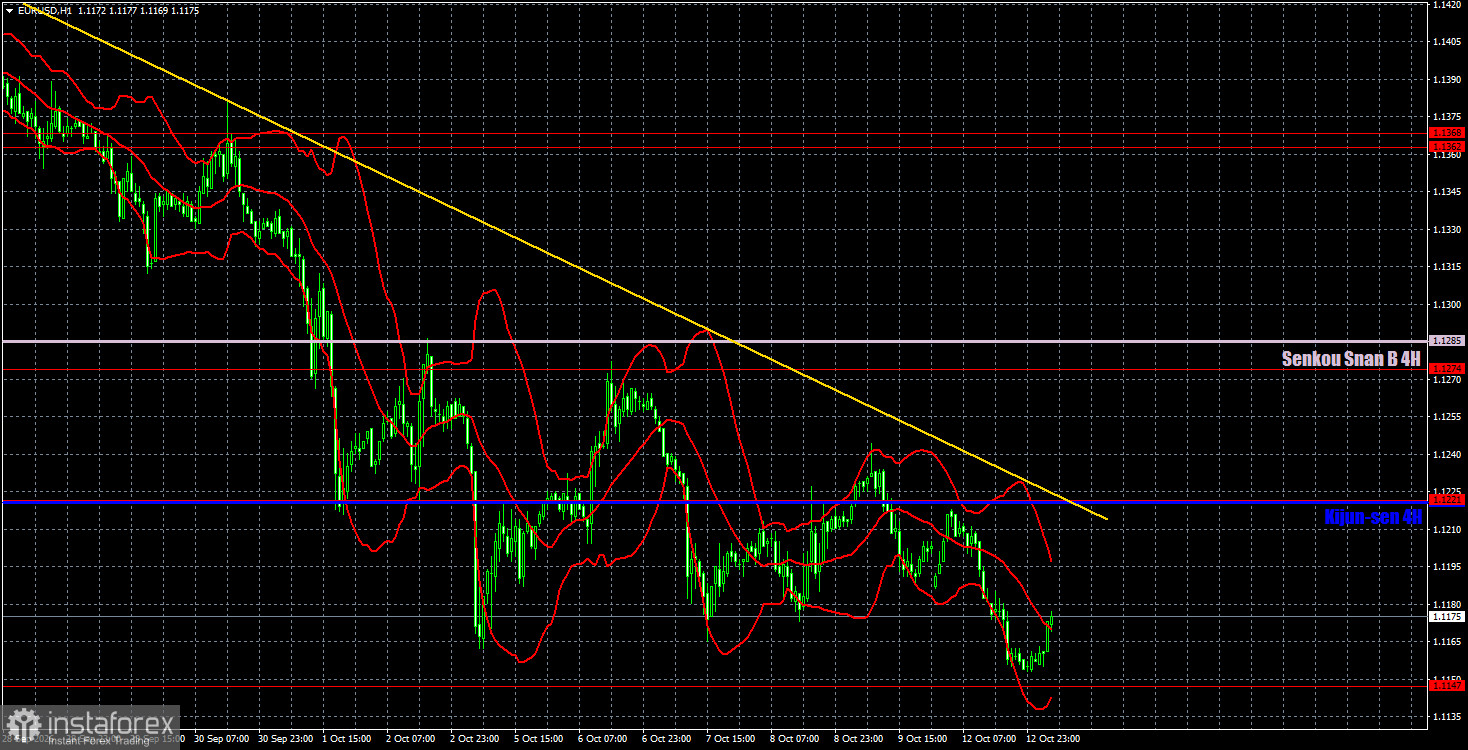
On the hourly timeframe, the EUR/USD pair continues forming a downward trend. The Fed greatly aided the development of the downward trend, but that factor is unlikely to explain dollar strength several weeks after the meeting. The European Central Bank should have supported the euro, having already raised rates twice in 2026, and US labour-market data should have weakened the dollar. But the market now sees no factors supporting the euro. Thus the dollar continues forming a strong trend that now depends only on market sentiment.
For October 13 we highlight the following levels for trading — 1.1092, 1.1147, 1.1221, 1.1274, 1.1362–1.1368, 1.1461–1.1473, 1.1536–1.1542, 1.1585, 1.1657–1.1665, as well as Senkou Span B (1.1285) and Kijun-sen (1.1220). The Ichimoku lines may shift during the day, which should be taken into account when determining trading signals. Do not forget to move Stop Loss to breakeven if price has moved 15 pips in the correct direction. This will protect against potential losses if the signal proves false.
On Tuesday, there are no important events scheduled in the Eurozone, while the US will publish the existing-home sales report, which is unlikely to interest the market much. Therefore, we do not expect strong moves today, but the euro may continue to decline.
Traders may consider targets for short positions near 1.1092 if price closes below 1.1147. In case the trendline is breached, consider targets for long positions at 1.1274 and 1.1362–1.1368.
Le recensioni analitiche di InstaForex ti renderanno pienamente consapevole delle tendenze del mercato! Essendo un cliente InstaForex, ti viene fornito un gran numero di servizi gratuiti per il trading efficiente.


