 Rimani

Condizioni di trading
Strumenti


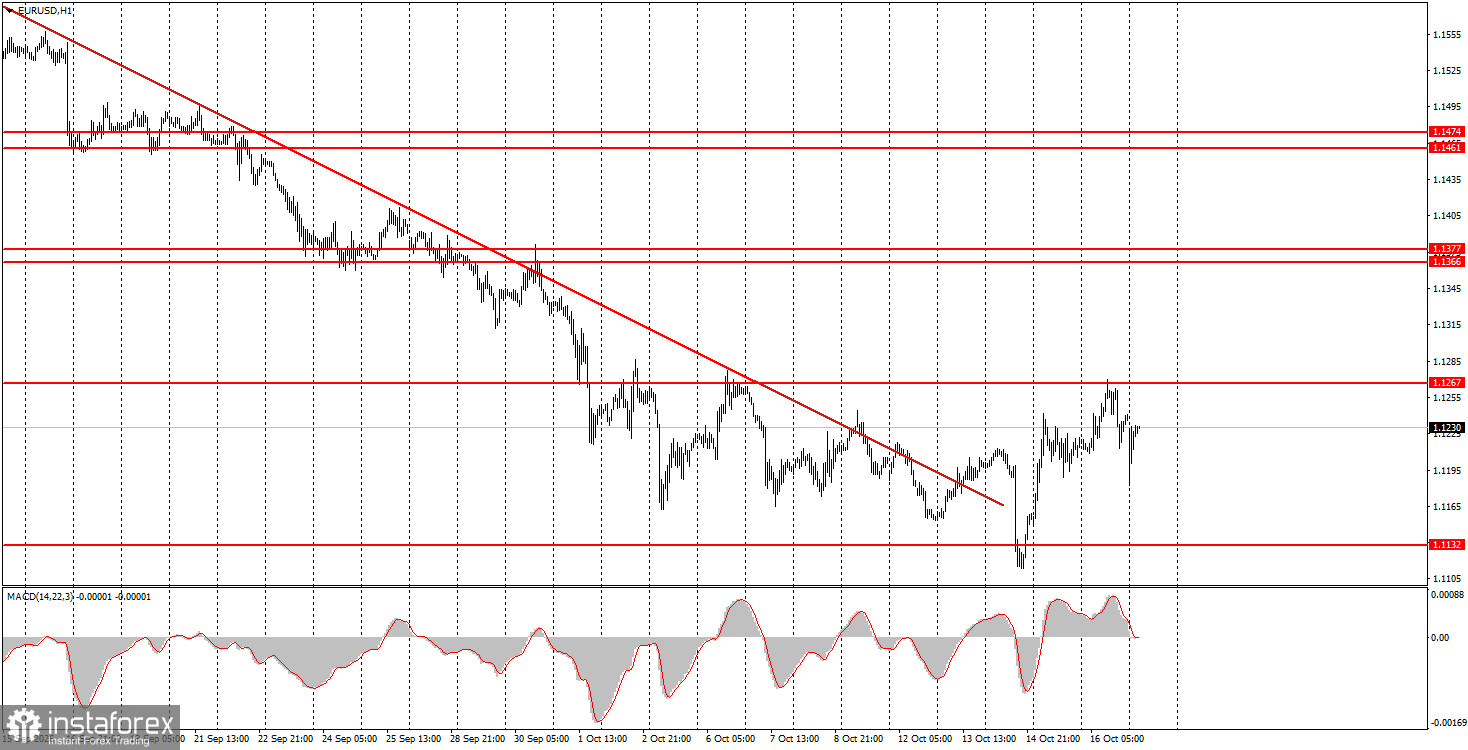
EUR/USD tried to extend its upward move on Friday, but overall volatility was low, and the market bought the euro and sold the dollar less aggressively than on Wednesday or Thursday. Recall that earlier in the week three important US inflation releases could — and arguably should — have driven dollar strength. In all three prints, inflation surprised to the upside, raising the odds of more aggressive Federal Reserve tightening. Yet the dollar had already been rising nearly every day for a month, often ignoring macro and fundamental context. That couldn't go on forever, and the market had priced in most dollar-bull factors. Fed chair Kevin Warsh spoke on Friday but gave no major new signals. The market had hoped for stronger hawkish rhetoric but didn't get it, so the dollar softened further across markets. Overall, few fundamental reasons remain for further dollar strength.
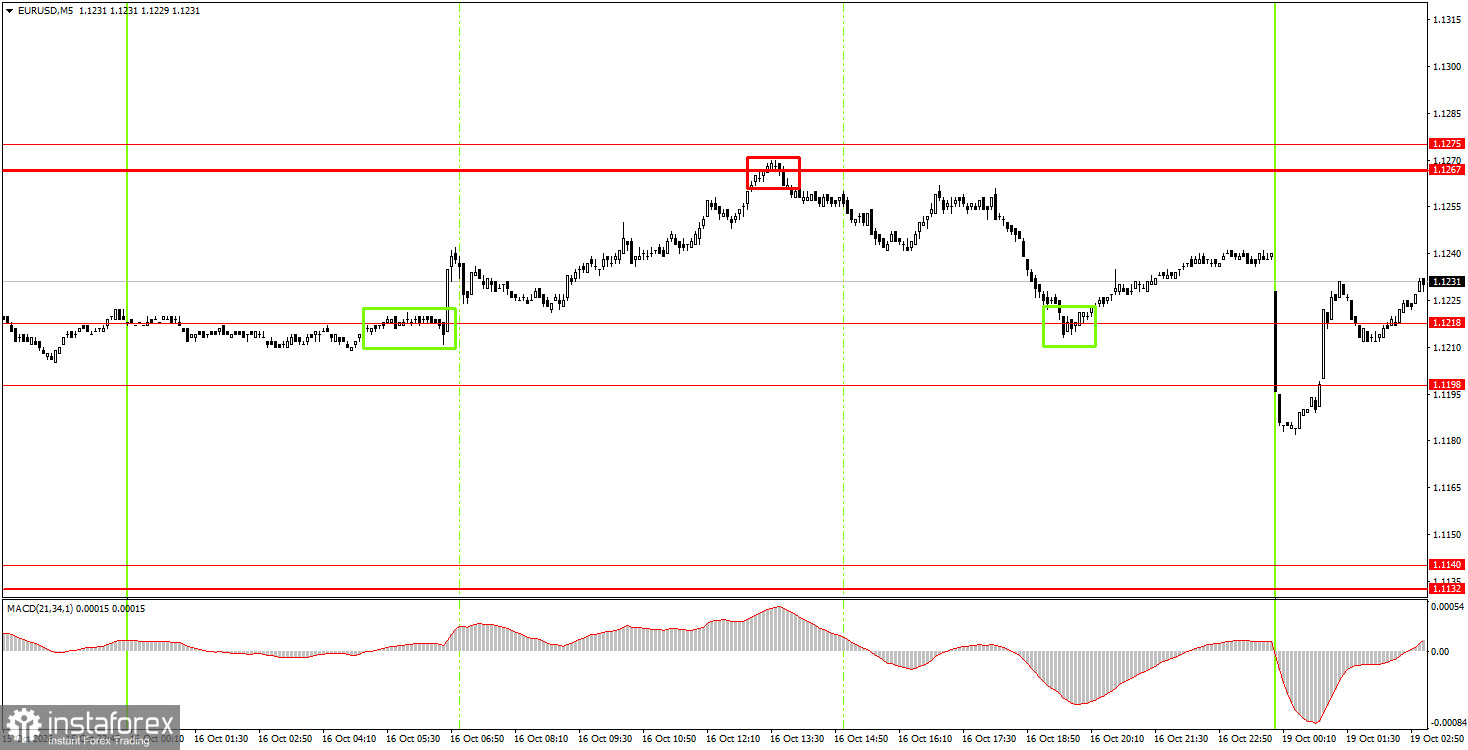
On the 5-minute timeframe, Friday produced three decent trading signals. The pair first bounced from the 1.1198–1.1218 area, then rallied toward 1.1267–1.1275, bounced there, and returned to the 1.1198–1.1218 zone. Novice traders could have taken up to three trades during the day, two of which were likely profitable.
On the hourly timeframe, EUR/USD still reflects a downtrend that has been a full trend, but there are reasons to believe that the trend may be over. Over the past few months, we don't think the euro should have collapsed like a stone for an entire month. The dollar now looks heavily overbought, and many euro-positive fundamentals have been ignored.
On Monday, novice traders may consider new short positions if price closes below the 1.1198–1.1218 area, targeting 1.1132–1.1140. Open long positions on a rebound from the 1.1198–1.1218 area, targeting 1.1267–1.1275.
On the 5-minute timeframe consider the levels 1.1011, 1.1088, 1.1132–1.1140, 1.1198–1.1218, 1.1267–1.1275, 1.1366–1.1377, 1.1461–1.1474, 1.1527–1.1531, 1.1584–1.1594, 1.1655–1.1665. No major events are scheduled for Monday in the US or the Eurozone, so traders will have little to react to. The week began actively, with renewed dollar strength driven by events in France, but the market has since calmed.
Price levels (areas) of support and resistance serve as targets for opening buy or sell trades or as sources of signals.
Red lines indicate channels or trend lines that show the current trend and the preferred trading direction.
The MACD indicator (14,22,3) — the histogram and signal line — is an auxiliary indicator that can also provide signals.
Important speeches and reports (listed in the news calendar) can significantly influence currency pair movements. Therefore, during their release, traders should approach trading with utmost caution, or exit the market to avoid sudden reversals against the preceding move.
Beginner forex traders should remember that not every trade can be profitable. Developing a clear strategy and practicing money management are key to long-term success in trading.
Le recensioni analitiche di InstaForex ti renderanno pienamente consapevole delle tendenze del mercato! Essendo un cliente InstaForex, ti viene fornito un gran numero di servizi gratuiti per il trading efficiente.


