 Rimani


Condizioni di trading
Strumenti


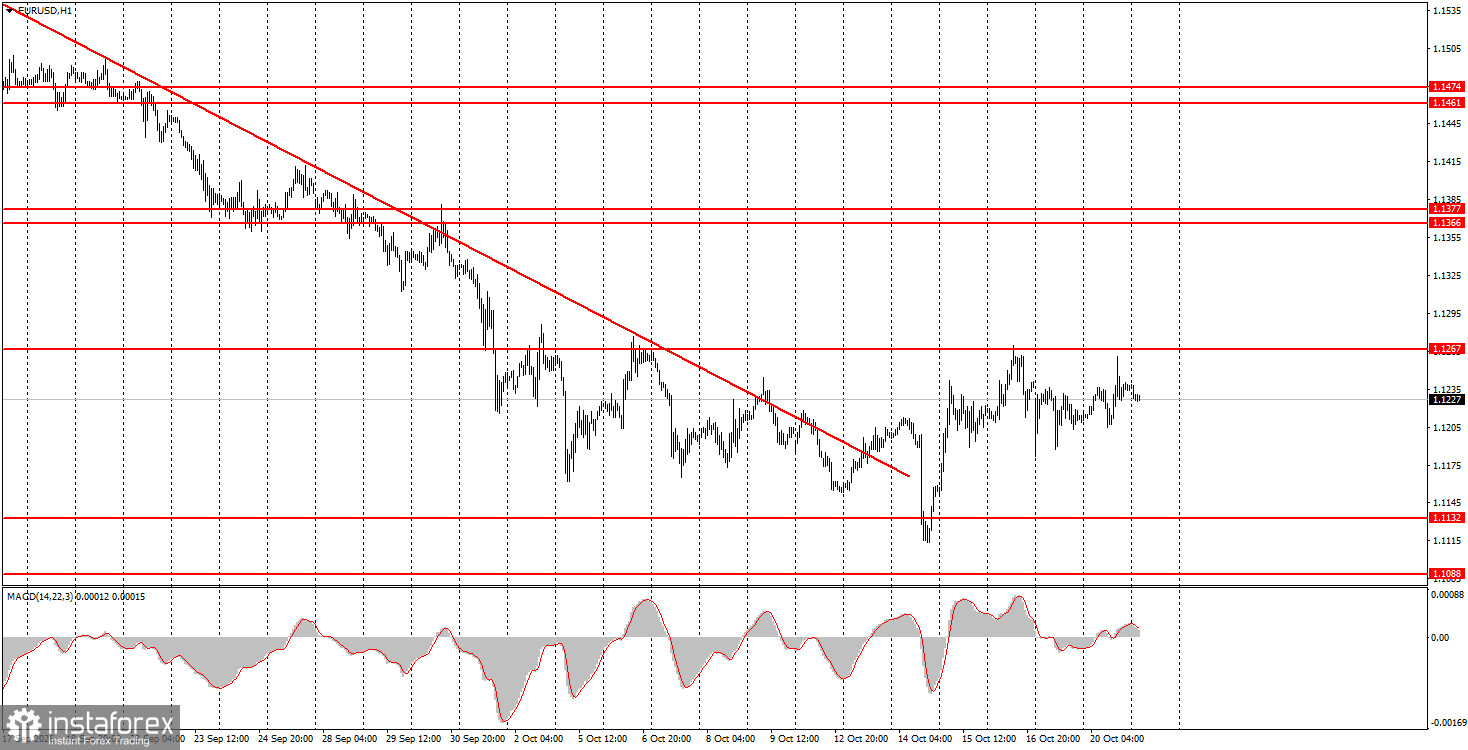
EUR/USD again showed no meaningful moves on Tuesday because the macro and fundamental backdrop was weak. Morning releases in the Eurozone and Germany were the ZEW economic-sentiment indices, and in the afternoon the US published housing starts and building permits. The ZEW prints caused a small dip in the euro, while the US housing reports were ignored. Total intraday volatility was about 56 pips. The euro held its hard-won positions, but further gains remain hard to achieve. The technical picture is unchanged: the trendline has been breached, but the pair cannot clear 1.1267 and has traded more sideways than up or down for several weeks. In short, the euro still lacks broad market support. Many fundamentals point to euro strength, but the market remains close to the dollar and can resume dollar buying at any time.
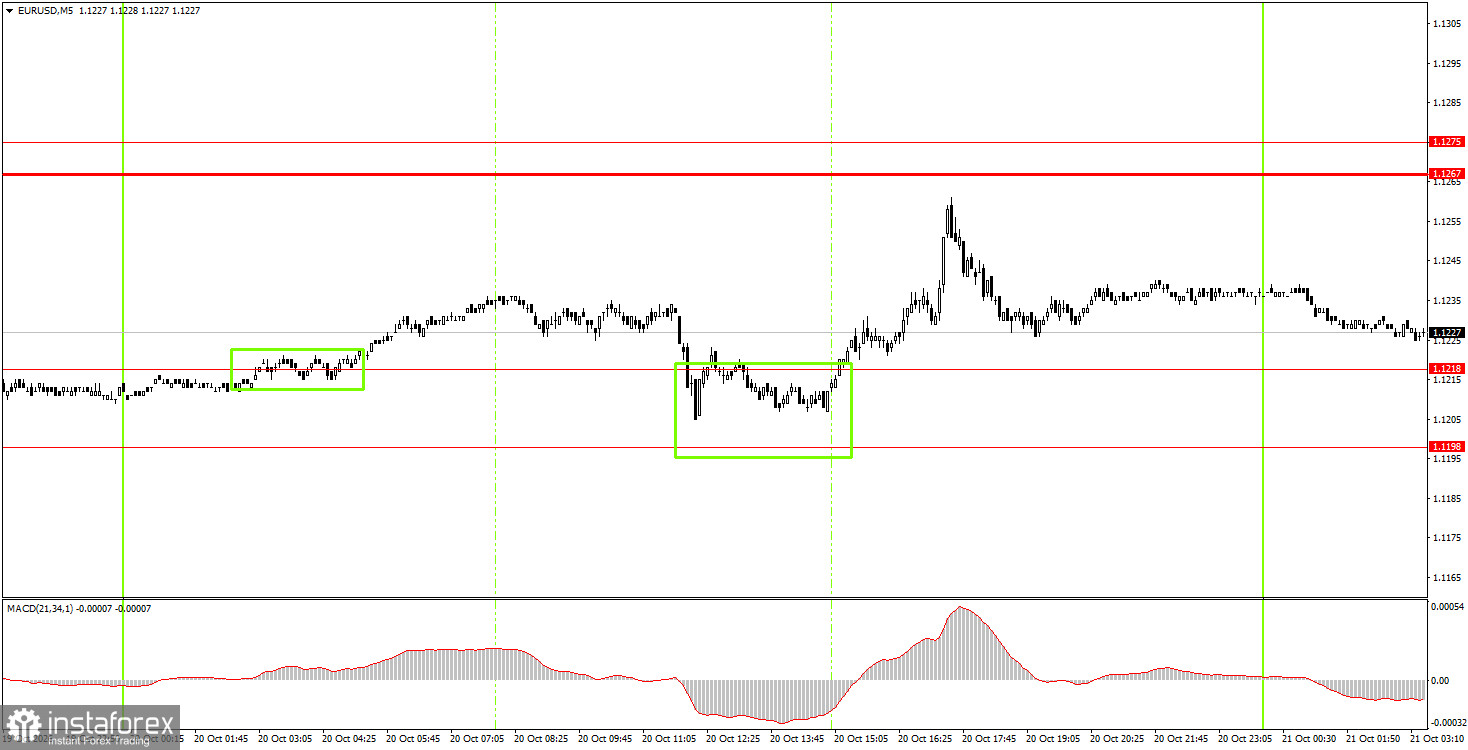
On the 5-minute chart, Tuesday produced two buy signals. Price bounced twice from the 1.1198–1.1218 area. The first bounce gained about 7 pips; the second, about 30 pips. The buy signals were duplicates, so profits were small but positive.
On the hourly timeframe, EUR/USD still shows a downtrend that qualifies as a full trend, but there are grounds to think that trend may be over. Over the past few months, we do not believe the euro should have collapsed like a stone for a whole month. The dollar looks heavily overbought, and many euro-positive factors have been ignored.
On Wednesday, novice traders may consider short positions if price closes below the 1.1198–1.1218 area, targeting 1.1132–1.1140. Open long positions on a rebound from the 1.1198–1.1218 area, targeting 1.1267–1.1275.
On the 5-minute timeframe watch these levels: 1.1011, 1.1088, 1.1132–1.1140, 1.1198–1.1218, 1.1267–1.1275, 1.1366–1.1377, 1.1461–1.1474, 1.1527–1.1531, 1.1584–1.1594, 1.1655–1.1665. On Wednesday, European Central Bank President Christine Lagarde will speak — a potentially important event one week ahead of the ECB meeting. The US economic calendar is empty, so expect the European session and Lagarde's remarks to dominate price action.
Price levels (areas) of support and resistance serve as targets for opening buy or sell trades or as sources of signals.
Red lines indicate channels or trend lines that show the current trend and the preferred trading direction.
The MACD indicator (14,22,3) — the histogram and signal line — is an auxiliary indicator that can also provide signals.
Important speeches and reports (listed in the news calendar) can significantly influence currency pair movements. Therefore, during their release, traders should approach trading with utmost caution, or exit the market to avoid sudden reversals against the preceding move.
Beginner forex traders should remember that not every trade can be profitable. Developing a clear strategy and practicing money management are key to long-term success in trading.
Le recensioni analitiche di InstaForex ti renderanno pienamente consapevole delle tendenze del mercato! Essendo un cliente InstaForex, ti viene fornito un gran numero di servizi gratuiti per il trading efficiente.


