 Rimani
Condizioni di trading
Strumenti


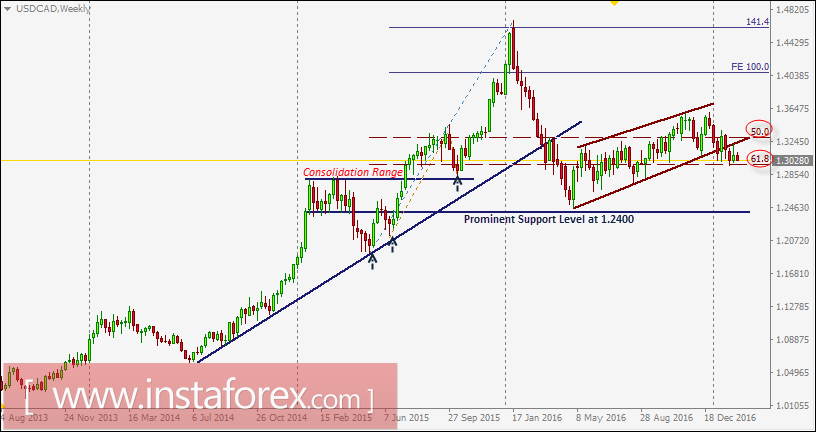
The USD/CAD pair challenged the upper limit of the depicted channel around 1.3360-1.3400 which succeeded to apply enough bearish pressure on the pair.
Shortly after, a bearish engulfing weekly candlestick was expressed by the end of the week indicating strong resistance around 1.3550.
Bearish persistence below the price level of 1.3300 (50% Fibonacci Level) was achieved.
This allowed a further decline toward 1.3200 and 1.3080 (the lower limit of the depicted channel) where bullish rejection was expressed as anticipated.
A bullish breakout above 1.3360 (50% Fibonacci level) was expected to allow a further advance toward 1.3700-1.3750 (the upper limit of the depicted channel). However, significant bearish rejection was expressed around 1.3580 (recent established top).
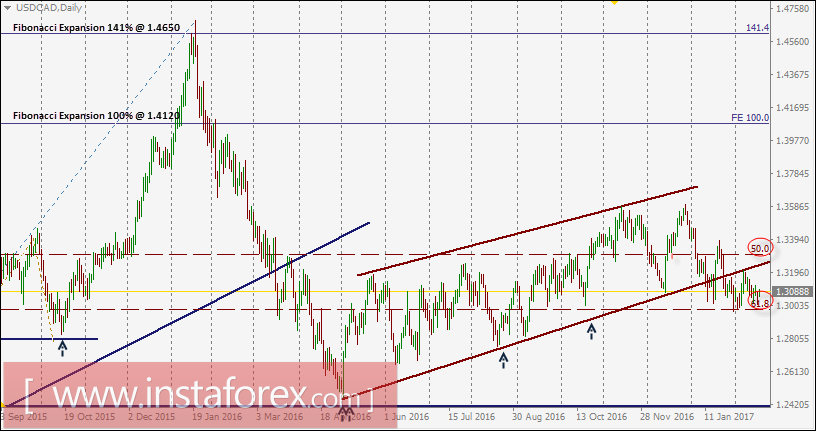
The price level of 1.3300 (50% Fibonacci Level) failed to provide enough support for the recent bearish pullback.
That is why the recent bearish pullback toward 1.2970 (61.8% Fibonacci level) offered a valid BUY entry as expected in previous articles.
This week, a bullish breakout above 1.3300 (50% Fibonacci Level) is needed to enhance bullish advance toward 1.3440 and 1.3550. Otherwise, the USD/CAD pair remains trapped within the current consolidation range (1.2970-1.3300).
On the other hand, DAILY closure below 1.2970 (61.8% Fibonacci level) will confirm a double-top pattern with projected bearish targets at 1.2860, 1.2730, and 1.2600.
Le recensioni analitiche di InstaForex ti renderanno pienamente consapevole delle tendenze del mercato! Essendo un cliente InstaForex, ti viene fornito un gran numero di servizi gratuiti per il trading efficiente.


