 Rimani
Condizioni di trading
Strumenti


Global macro overview for 20/02/2017:
The Baker Hughes US Oil Rig Count data released last Friday revealed that the number of active oil rigs has increased for a fifth successive week. Currently, there are 597 active oil rigs in the US for the week ending February 17, which is a 6 more than the last week. Moreover, the total amount of oil rigs is the biggest number since the week of October 9, 2015, when the count was 605 (last week the oil-rig count rose by 8 to 591, while the total rig count increased by 12 to 741). In conclusion, the current data shows an ongoing increase in a number of active oil rigs, but there are still far away from the records highs in 2015 when over 1,600 oil rigs were active. Nevertheless, this uptrend is going to last, then the crude oil producer might have to face another problem besides global supply glut.
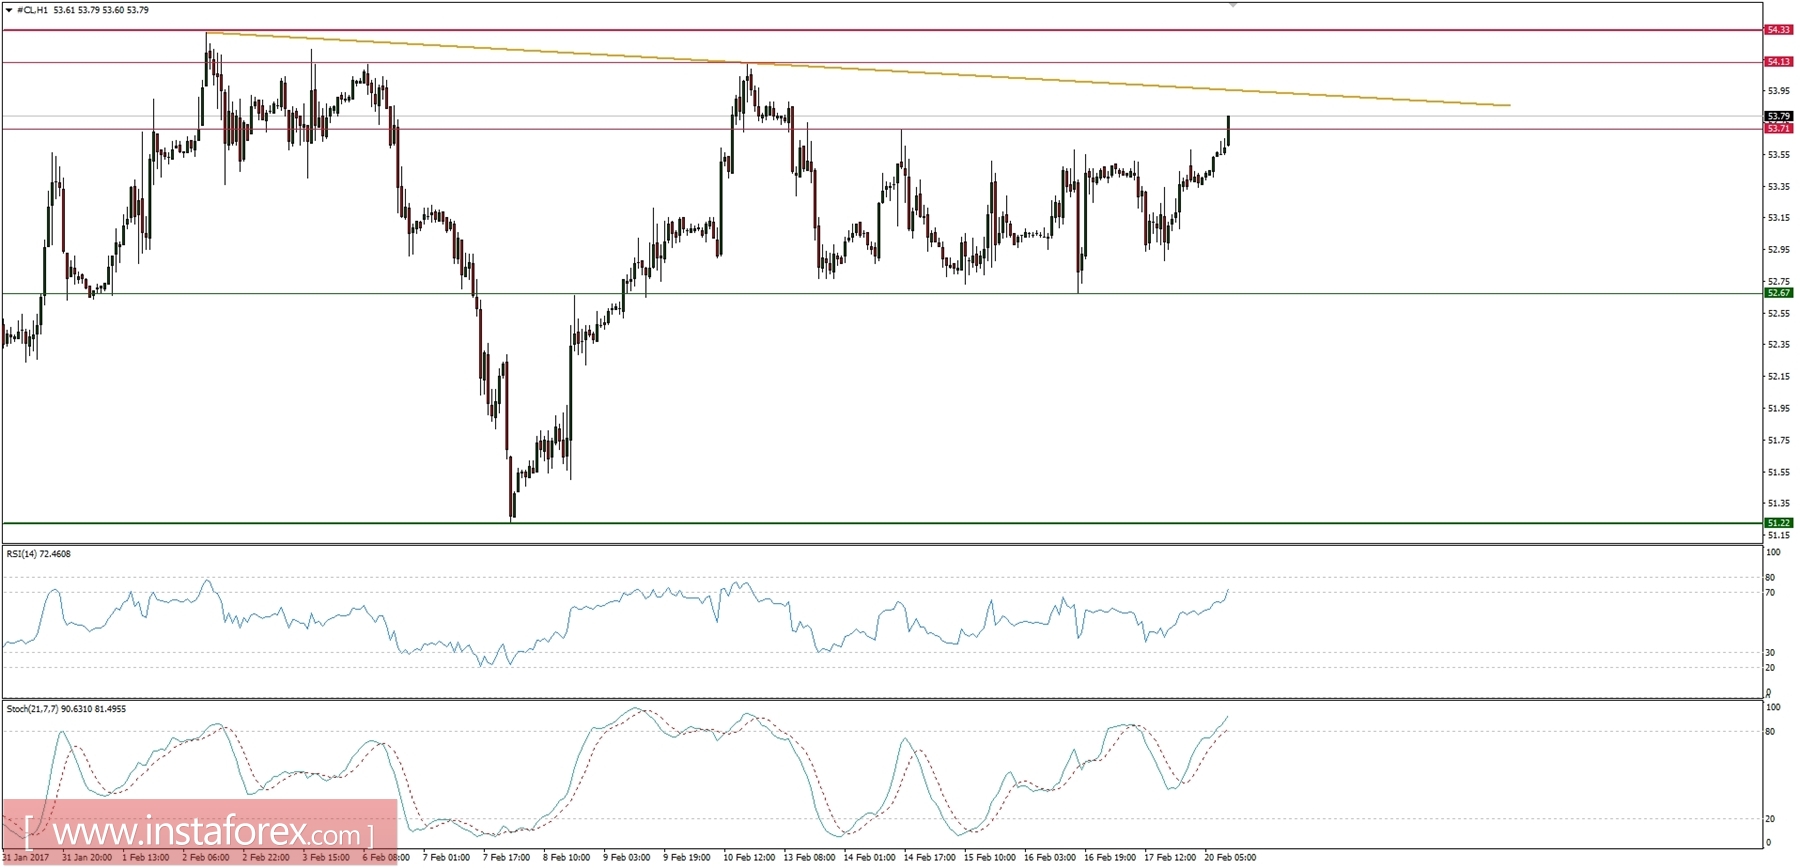
Let's now take a look at the Crude Oil technical picture at the H1 time frame. The bulls have managed to break out above the intraday resistance at the level of 53.71 and now they are trying to test the golden trendline around the level of 54.00. If the trendline is clearly violated, then the next level to test is the technical resistance at the level of 54.33.
Le recensioni analitiche di InstaForex ti renderanno pienamente consapevole delle tendenze del mercato! Essendo un cliente InstaForex, ti viene fornito un gran numero di servizi gratuiti per il trading efficiente.

