 Rimani
Condizioni di trading
Strumenti


The pair had a bullish session on Thursday, where it is facing the resistance zone at 1.2546. There should be some counter-trend reaction in order to correct the overall bias; and while it stays above the 200 SMA, GBP/USD could reach the 1.2633 area. The Bollinger band is showing a kind of overbought market and that's a forecast of further corrective moves to take place in the short term.
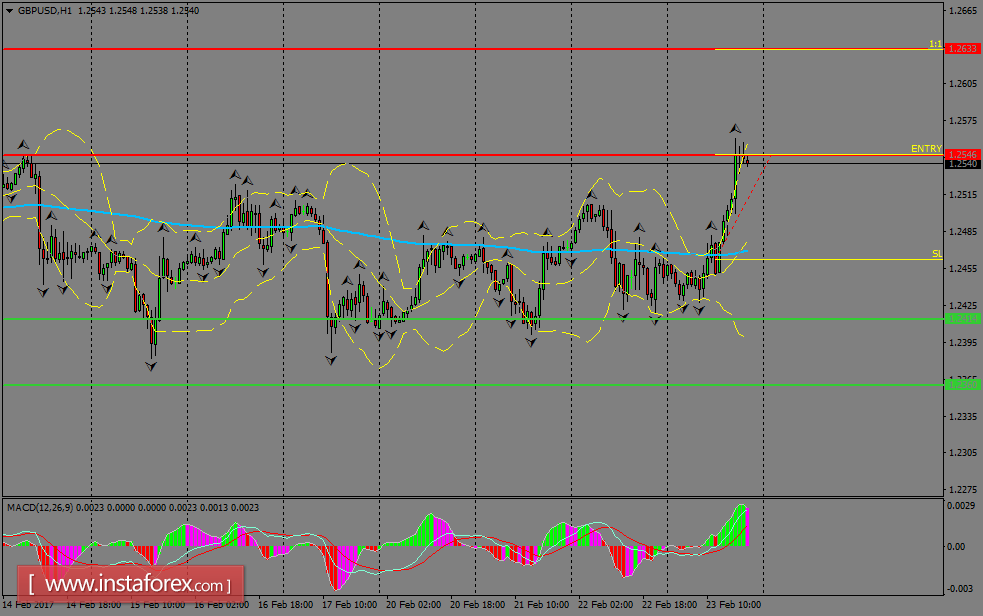
H1 chart's resistance levels: 1.2546 / 1.2633
H1 chart's support levels: 1.2414 / 1.2360
Trading recommendations for today: Based on the H1 chart, buy (long) orders only if the GBP/USD pair breaks a bullish candlestick; the resistance level is at 1.2546, take profit is at 1.2633 and stop loss is at 1.2462.
Le recensioni analitiche di InstaForex ti renderanno pienamente consapevole delle tendenze del mercato! Essendo un cliente InstaForex, ti viene fornito un gran numero di servizi gratuiti per il trading efficiente.


