 Rimani
Condizioni di trading
Strumenti


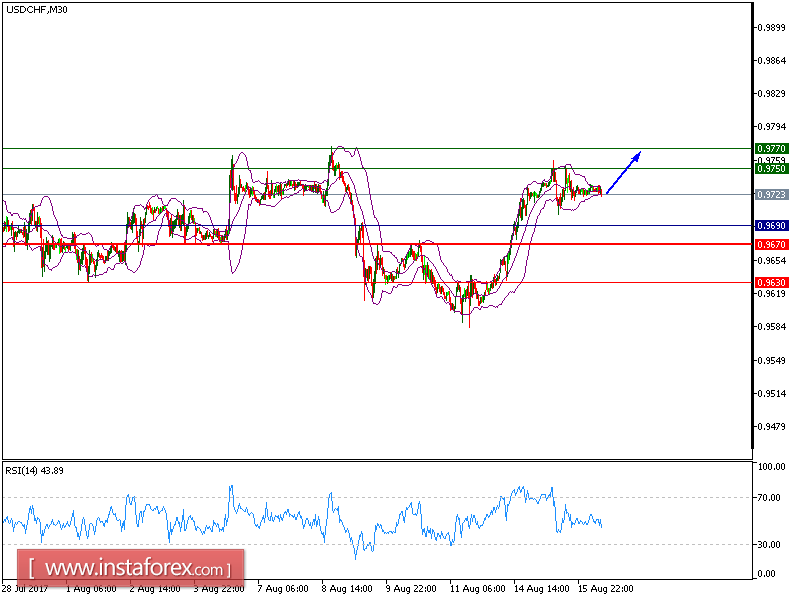
USD/CHF is expected to trade in a higher range and continue its upward movement. The pair is trading above the key support at 0.9690 (the low of August 15), which should limit the downside potential. The relative strength index lacks downward momentum. Even though a continuation of consolidation cannot be ruled out, its extent should be limited.
Regarding the U.S.-North Korea tensions, North Korea's state media reported that leader Kim Jong Un has delayed a decision on firing missiles towards Guam and he waits to see what the U.S. does.
On the economic data front, the U.S. Commerce Department reported that retail sales rose 0.6% on month in July, higher than +0.4% expected and the biggest gain since December. Excluding cars, retail sales were up 0.5%, still higher than +0.4% expected.
Hence, above 0.9690, look for a further upside to 0.9750 and even to 0.9770 in extension.
Chart Explanation: The black line shows the pivot point. The present price above the pivot point indicates the bullish position, and the price below the pivot points indicates the short position. The red lines show the support levels and the green line indicates the resistance levels. These levels can be used to enter and exit trades.
Strategy: BUY, Stop Loss: 0.9690, Take Profit: 0.9750
Resistance levels: 0.9750, 0.9770, and 0.9805
Support levels: 0.9670, 0.9630, and 0.9600
Le recensioni analitiche di InstaForex ti renderanno pienamente consapevole delle tendenze del mercato! Essendo un cliente InstaForex, ti viene fornito un gran numero di servizi gratuiti per il trading efficiente.


