
 Rimani


I pattern sono modelli grafici che forma il prezzo nel grafico. Secondo uno dei postulati dell'analisi tecnica, la storia (movimento dei prezzi) si ripete. Ciò significa che i movimenti dei prezzi sono spesso simili nelle stesse situazioni, il che rende possibile prevedere con maggiore probabilità ulteriore sviluppo della situazione.
I pattern pertinenti di InstaForex è un servizio facile da usare che ti consente di conoscere gli ultimi cambiamenti del mercato e reagire agli eventi in tempo. Nel nostro servizio troverai sempre gli schemi più recenti e pertinenti su ogni coppia a qualunque ora.
was formed on 14.04 at 22:00:04 (UTC+0)
signal strength 1 of 5
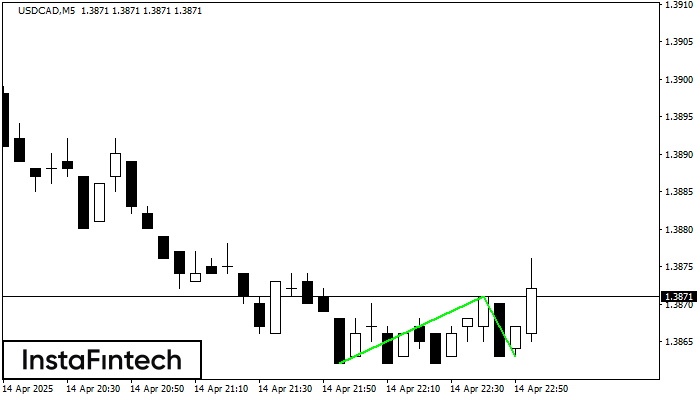
The Double Bottom pattern has been formed on USDCAD M5. Characteristics: the support level 1.3862; the resistance level 1.3871; the width of the pattern 9 points. If the resistance level is broken, a change in the trend can be predicted with the first target point lying at the distance of 8 points.
The M5 and M15 time frames may have more false entry points.


