
 Rimani


I pattern sono modelli grafici che forma il prezzo nel grafico. Secondo uno dei postulati dell'analisi tecnica, la storia (movimento dei prezzi) si ripete. Ciò significa che i movimenti dei prezzi sono spesso simili nelle stesse situazioni, il che rende possibile prevedere con maggiore probabilità ulteriore sviluppo della situazione.
I pattern pertinenti di InstaForex è un servizio facile da usare che ti consente di conoscere gli ultimi cambiamenti del mercato e reagire agli eventi in tempo. Nel nostro servizio troverai sempre gli schemi più recenti e pertinenti su ogni coppia a qualunque ora.
was formed on 05.05 at 16:29:57 (UTC+0)
signal strength 4 of 5
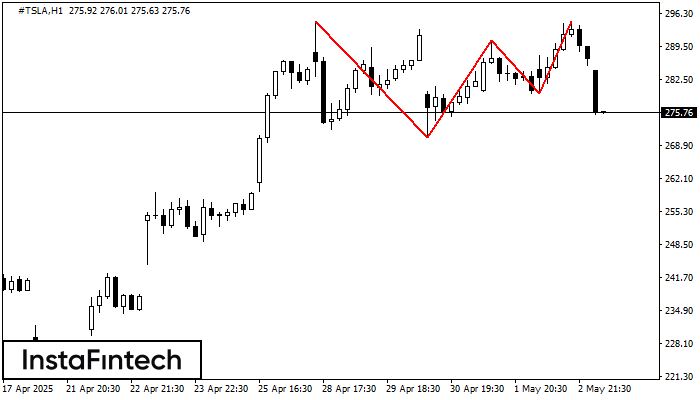
The Triple Top pattern has formed on the chart of the #TSLA H1. Features of the pattern: borders have an ascending angle; the lower line of the pattern has the coordinates 270.55/279.63 with the upper limit 294.59/294.52; the projection of the width is 2404 points. The formation of the Triple Top figure most likely indicates a change in the trend from upward to downward. This means that in the event of a breakdown of the support level of 270.55, the price is most likely to continue the downward movement.


