 Permanecer
Condiciones de negociación
Products
Herramientas


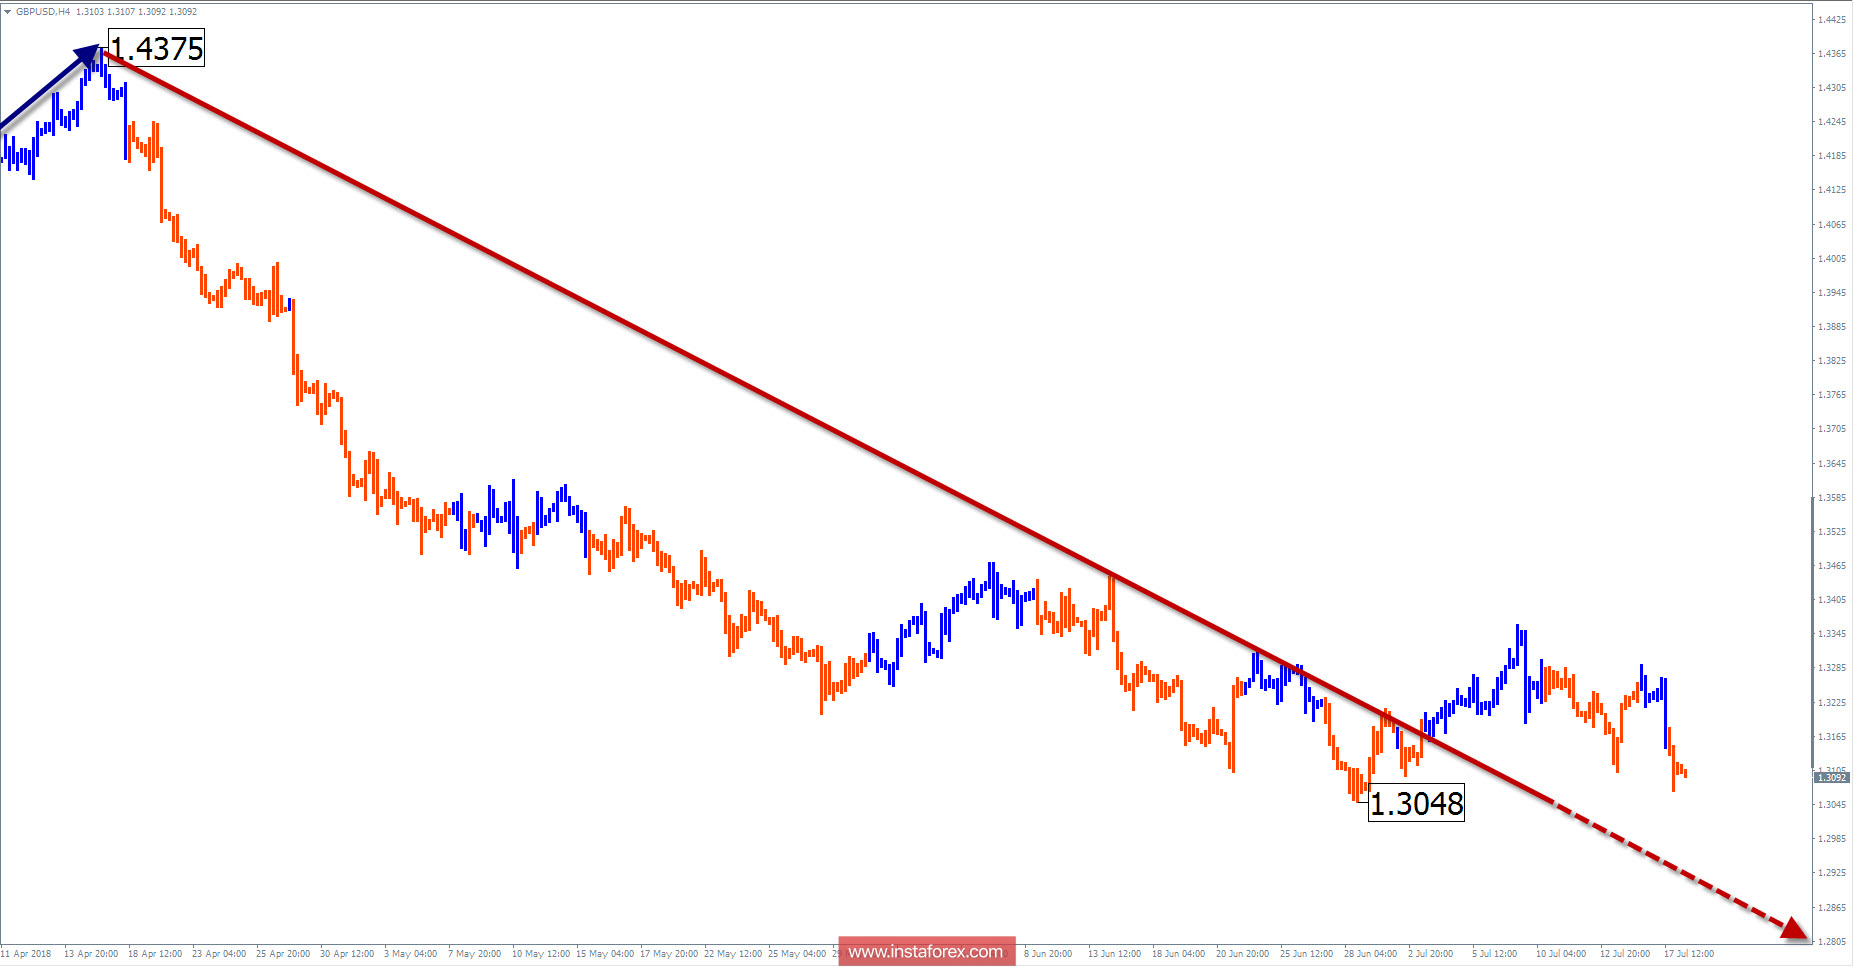
Wave picture of the H4 chart:
On the chart of the main pair of pound, a bearish zigzag is formed from January 25. For some time, the wave will move to a larger scale movement.
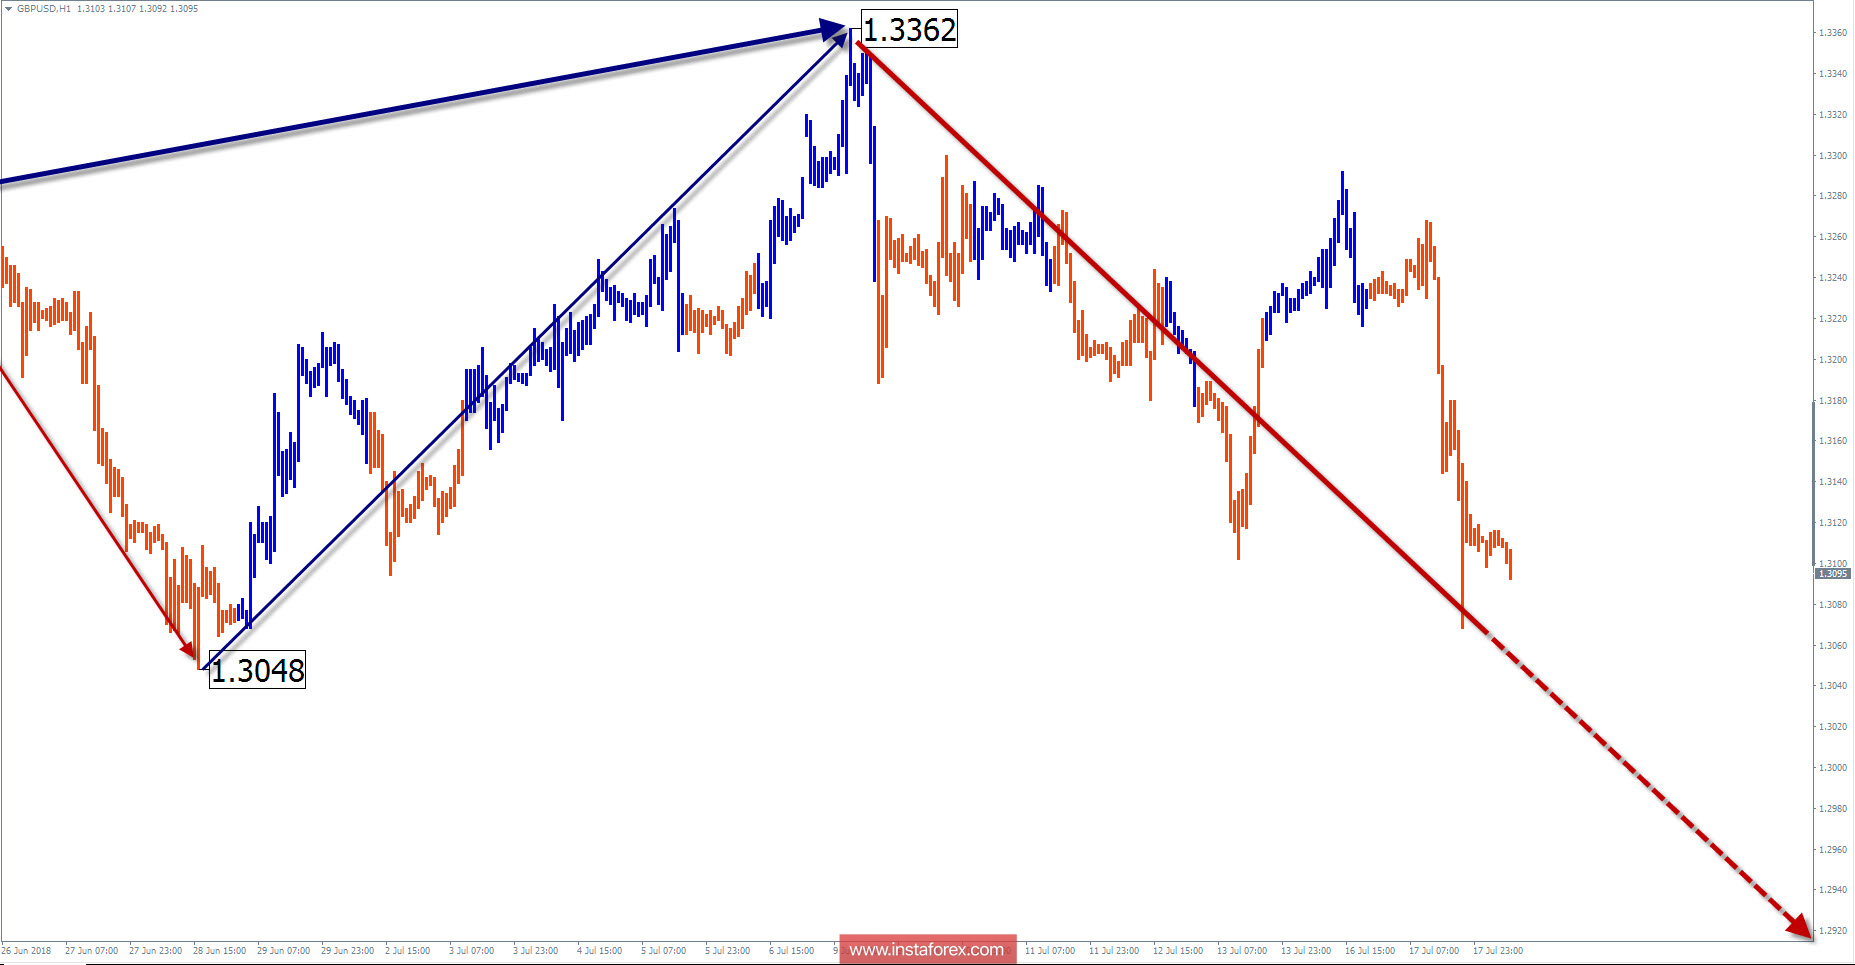
The wave pattern of the H1 graph:
The level of the descending wave of April 17 is already prepared to move to a larger scale of the movement. In early July, a hidden correction (B) was completed at the minimum levels.
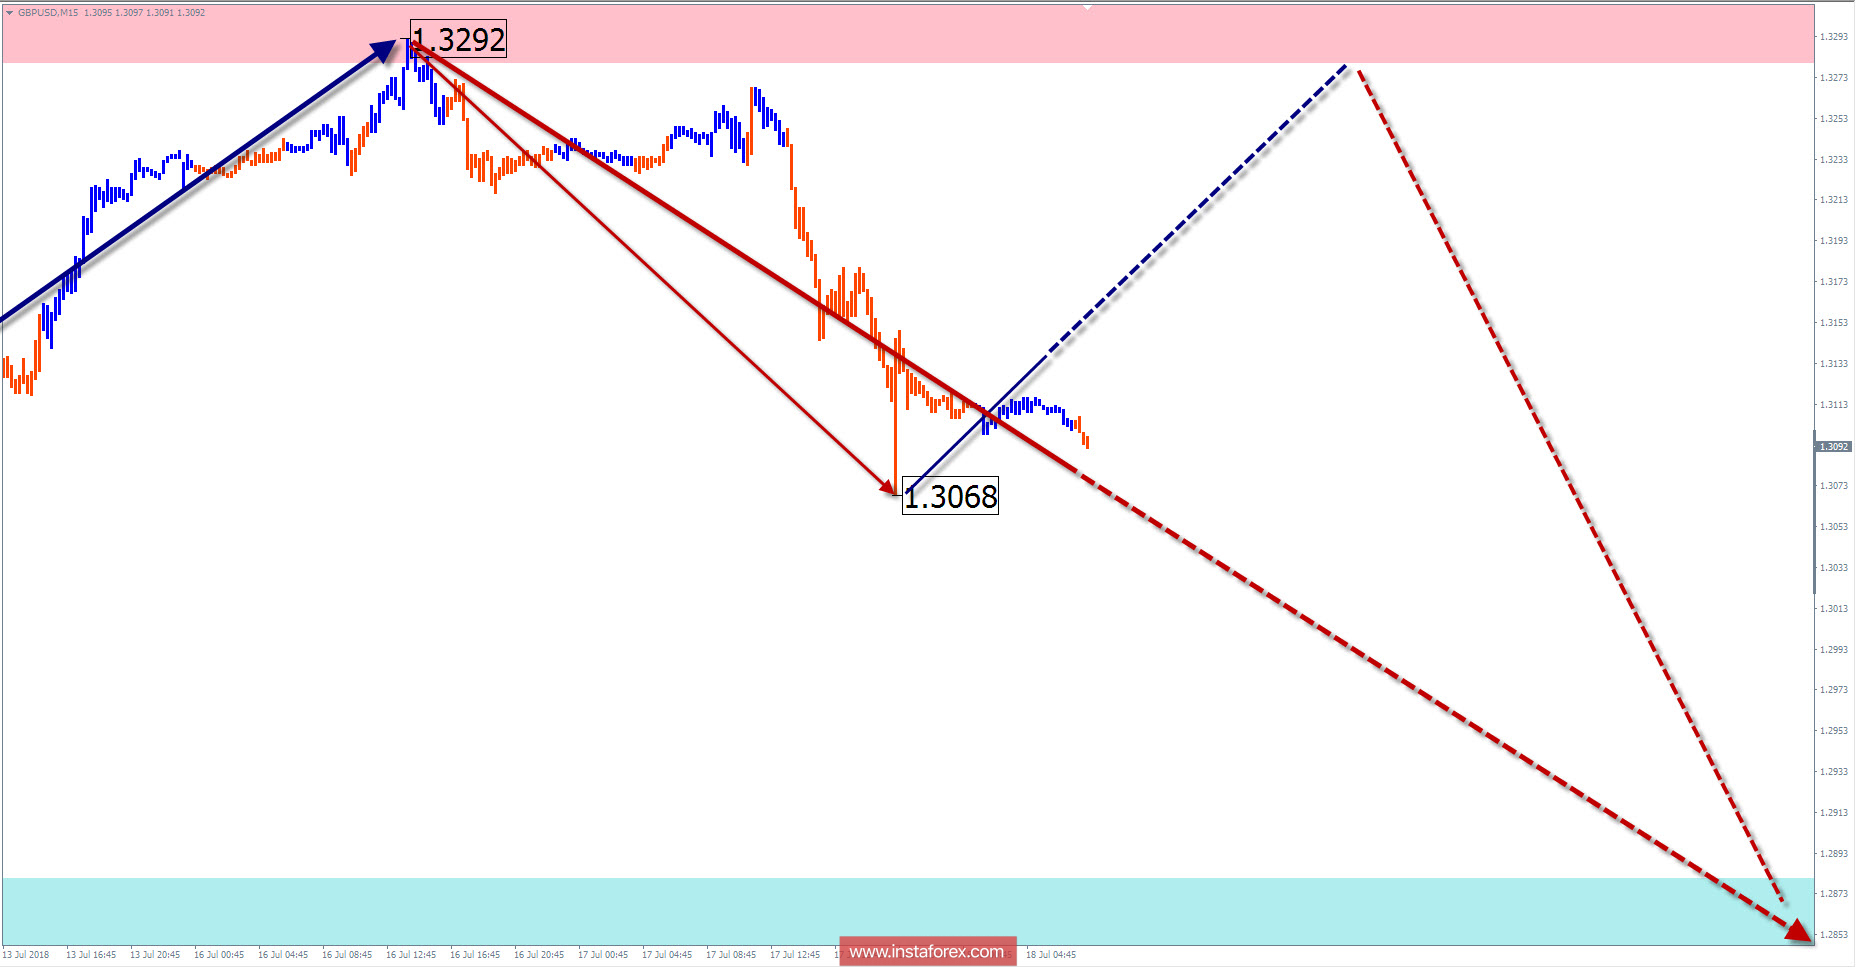
The wave pattern of the M15 chart:
Since July 9, a new wave has started in the main direction of the pair's movement. After a possible rollback up, the price in the coming days is waiting for a new round of decline.
Recommended trading strategy:
Proponents of long-term strategy before the opening of long positions should wait for the completion of the bearish correction. Trading on intraday fluctuations should focus on selling the pair.
Resistance zones:
- 1.3280 / 1.3330
Support zones:
- 1.2880 / 1.2830
Explanations to the figures: In a simplified wave analysis, waves consisting of 3 parts (A-B-C) are used. For analysis, 3 main TFs are used on each one, the last incomplete wave is analyzed. Zones show the calculated areas with the greatest probability of a turn.
Arrows indicate the wave counting according to the technique used by the author. The solid background shows the generated structure, the dotted - the expected movements.
Attention: The wave algorithm does not take into account the duration of the tool movements in time. To conduct a trade transaction, you need confirmation signals from your trading systems!
* The presented market analysis is informative and does not constitute a guide to the transaction.
¡Los informes analíticos de InstaForex lo mantendrá bien informado de las tendencias del mercado! Al ser un cliente de InstaForex, se le proporciona una gran cantidad de servicios gratuitos para una operación eficiente.


