 Zůstat
Obchodní podmínky
Nástroje


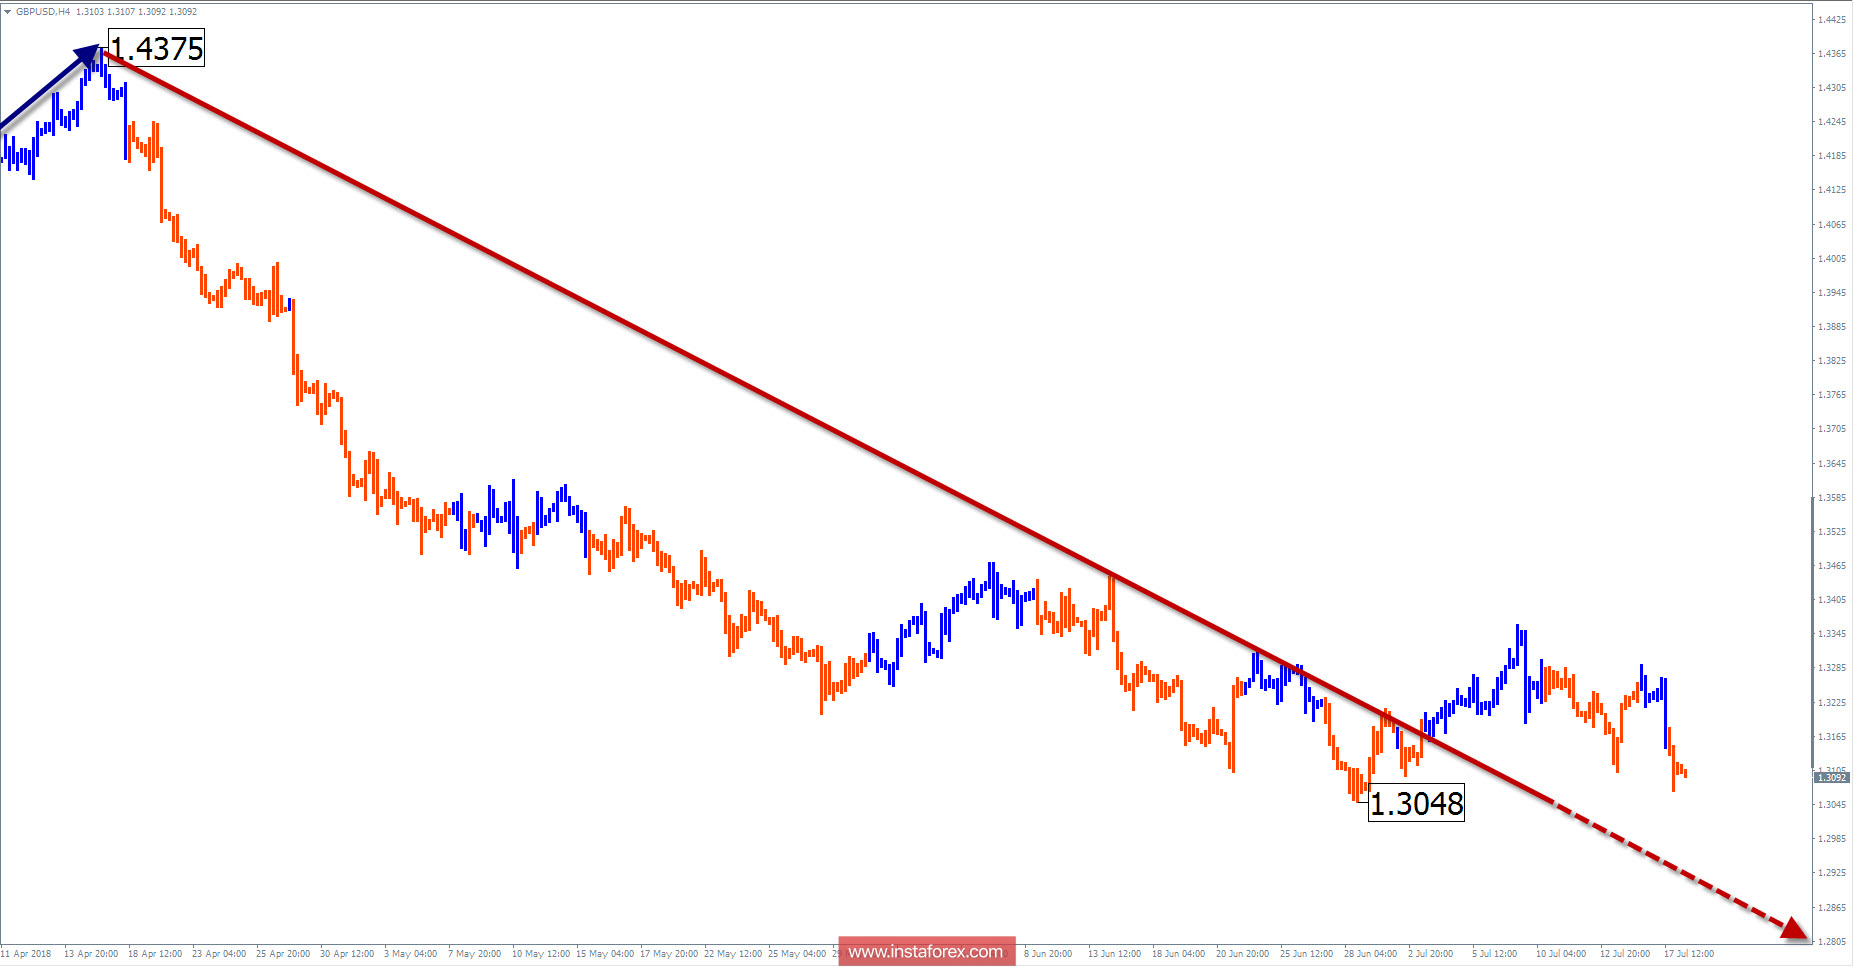
Wave picture of the H4 chart:
On the chart of the main pair of pound, a bearish zigzag is formed from January 25. For some time, the wave will move to a larger scale movement.
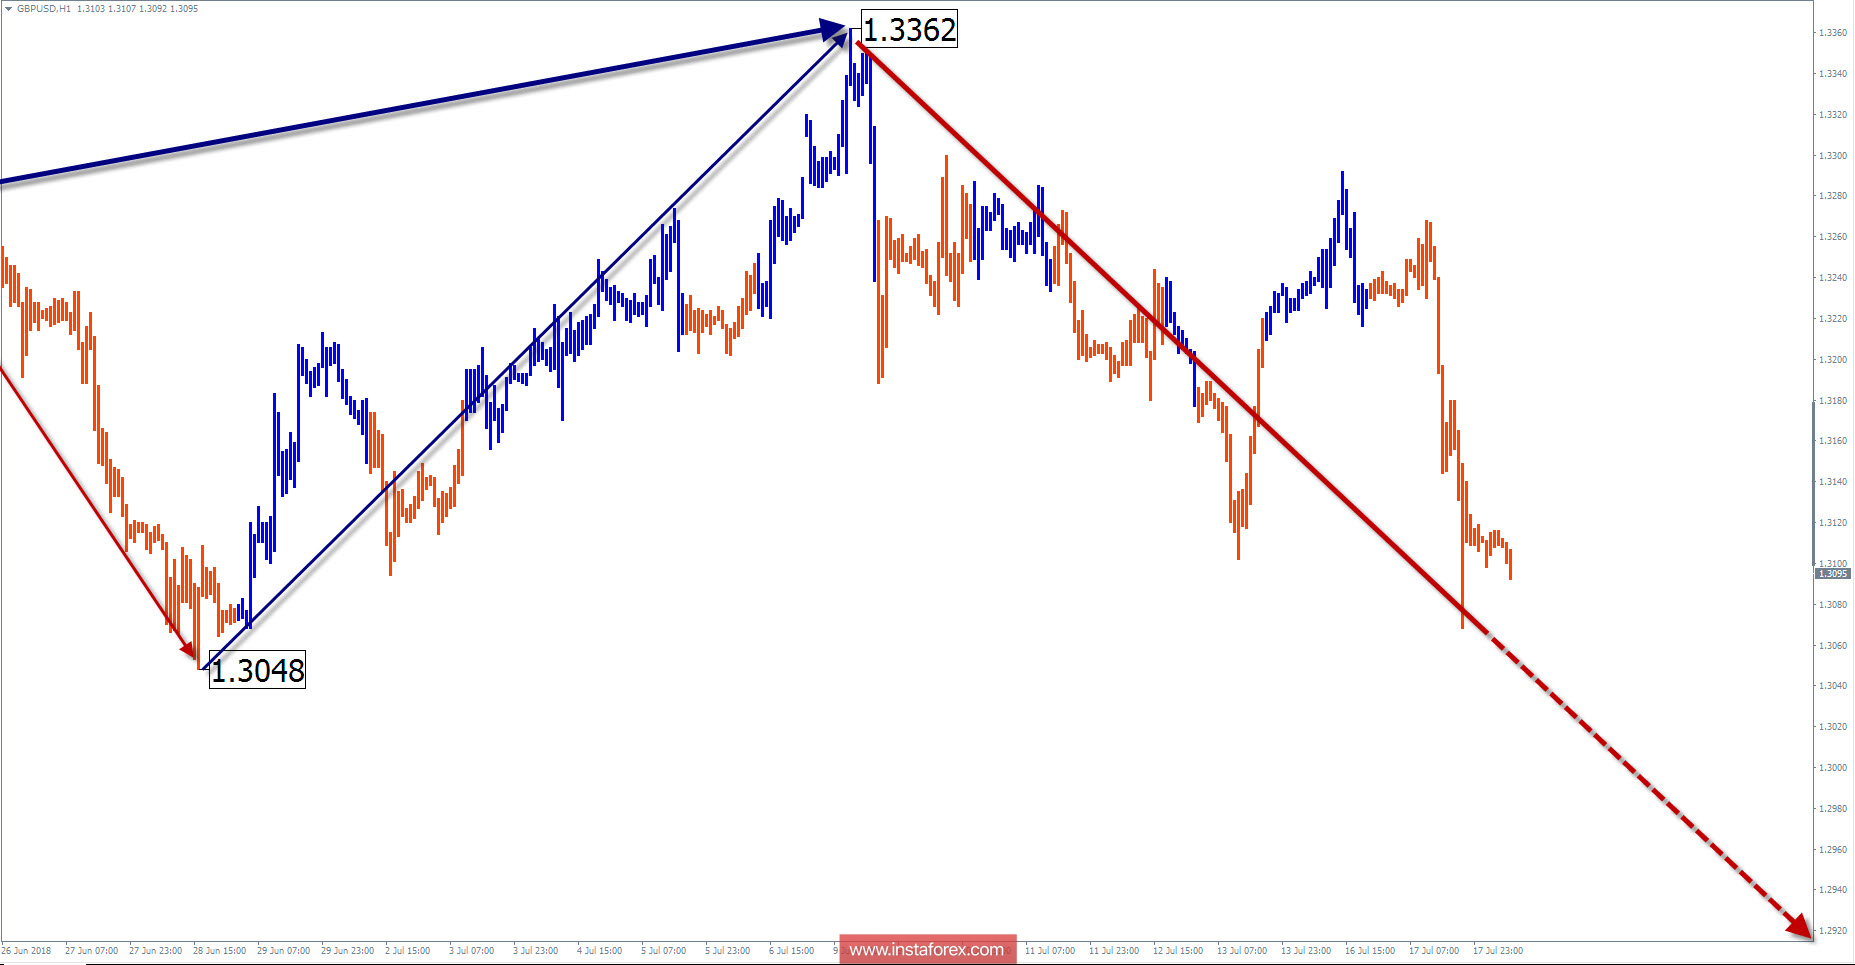
The wave pattern of the H1 graph:
The level of the descending wave of April 17 is already prepared to move to a larger scale of the movement. In early July, a hidden correction (B) was completed at the minimum levels.
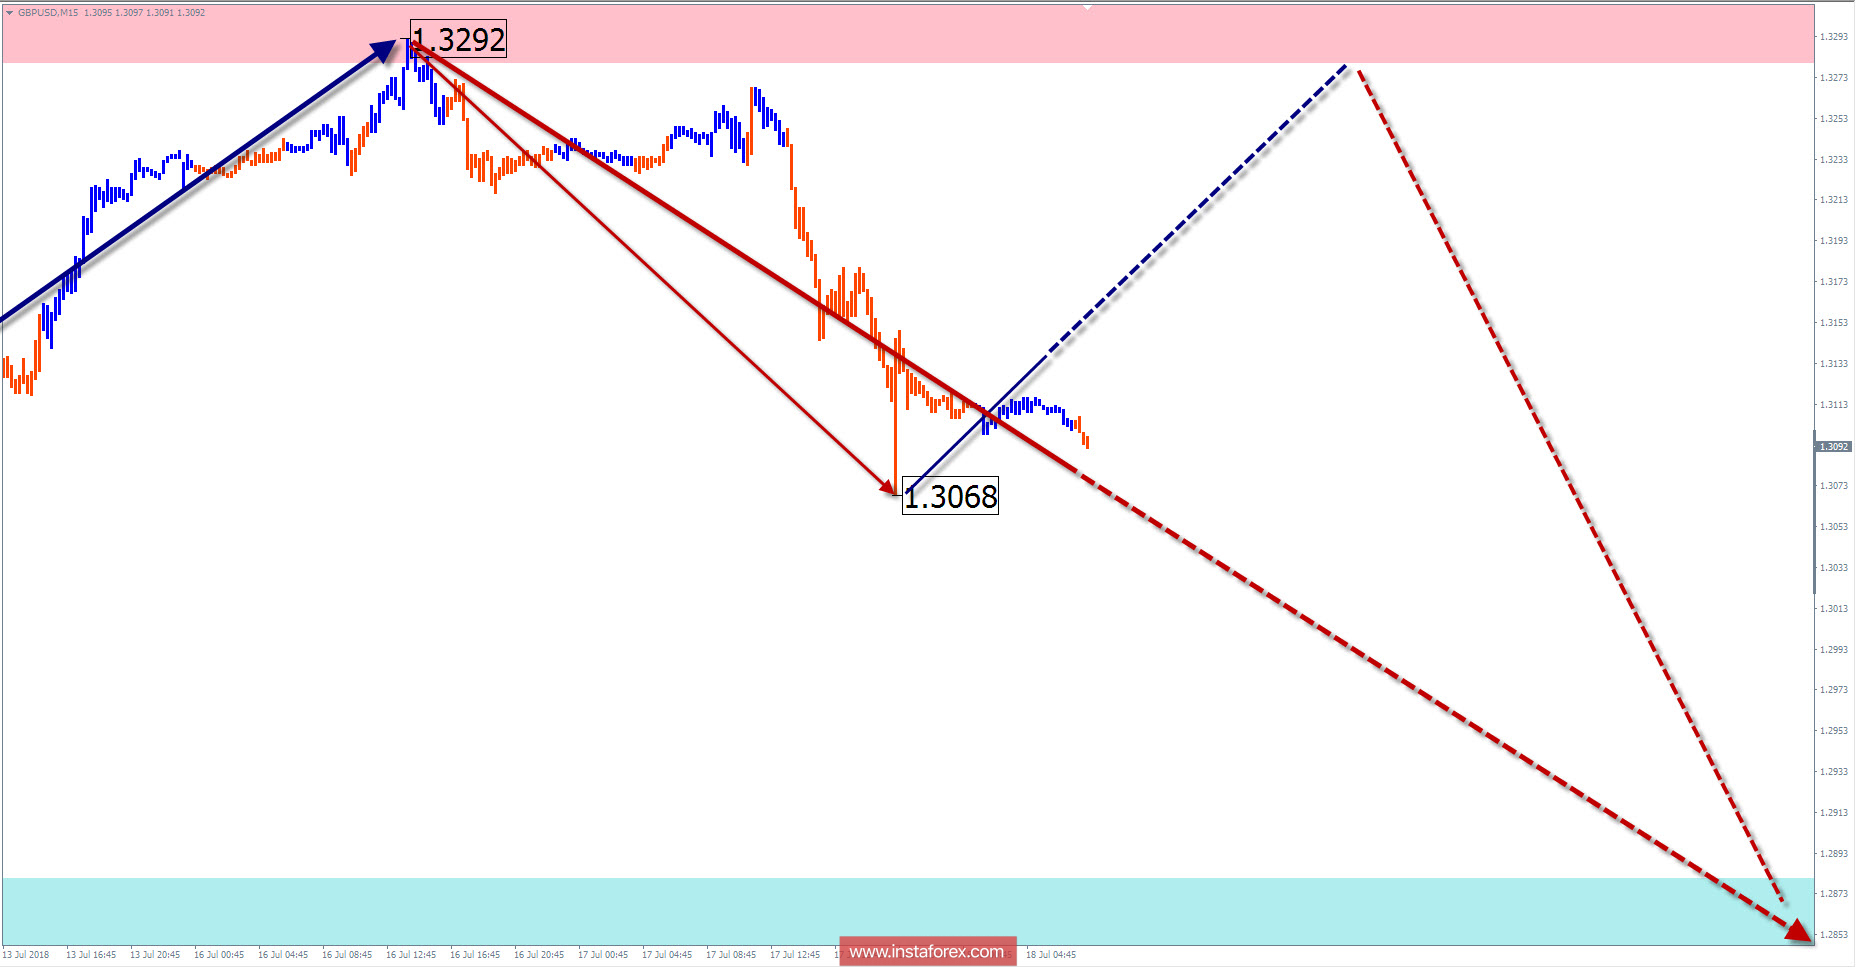
The wave pattern of the M15 chart:
Since July 9, a new wave has started in the main direction of the pair's movement. After a possible rollback up, the price in the coming days is waiting for a new round of decline.
Recommended trading strategy:
Proponents of long-term strategy before the opening of long positions should wait for the completion of the bearish correction. Trading on intraday fluctuations should focus on selling the pair.
Resistance zones:
- 1.3280 / 1.3330
Support zones:
- 1.2880 / 1.2830
Explanations to the figures: In a simplified wave analysis, waves consisting of 3 parts (A-B-C) are used. For analysis, 3 main TFs are used on each one, the last incomplete wave is analyzed. Zones show the calculated areas with the greatest probability of a turn.
Arrows indicate the wave counting according to the technique used by the author. The solid background shows the generated structure, the dotted - the expected movements.
Attention: The wave algorithm does not take into account the duration of the tool movements in time. To conduct a trade transaction, you need confirmation signals from your trading systems!
* The presented market analysis is informative and does not constitute a guide to the transaction.
Díky analytickým přehledům společnosti InstaForex získáte plné povědomi o tržních trendech! Jako zákazníkovi společnosti InstaForex je Vám k dispozici velký počet bezplatných služeb umožňujících efektivní obchodování.


