 Permanecer
Condiciones de negociación
Products
Herramientas

Trend analysis (Fig. 1).
The breakdown of the support line is unlikely. After testing this line, a pullback is possible with the first target 1.1116 - a pullback level of 14.6% (yellow dashed line).
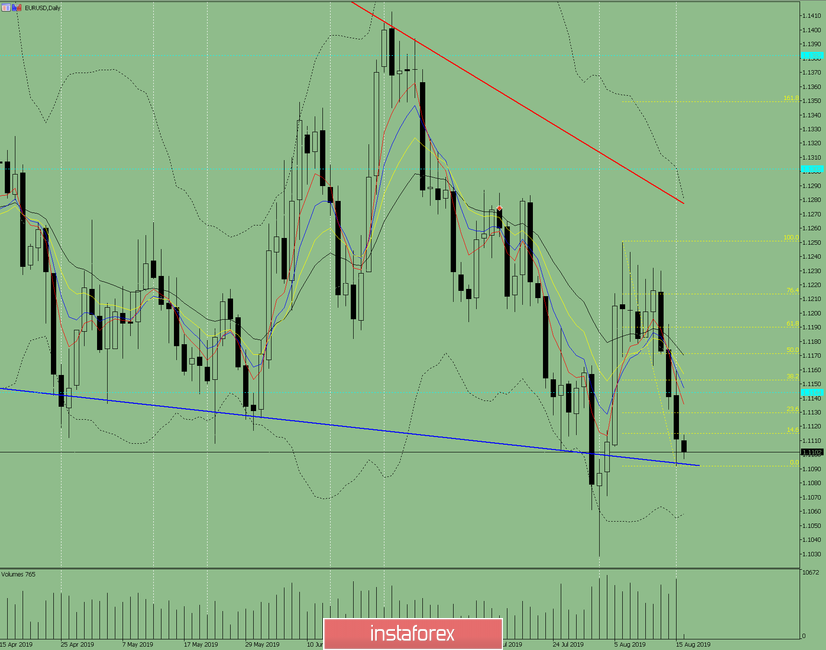
Fig. 1 (daily chart).
Comprehensive analysis:
- indicator analysis - down;
- Fibonacci levels - up;
- volumes - up;
- candlestick analysis - up;
- trend analysis - up;
- Bollinger Lines - down;
- weekly schedule - down.
General conclusion: up.
Low probability scenario - the downward movement will continue with the first target 1.1028 - the lower fractal.
¡Los informes analíticos de InstaForex lo mantendrá bien informado de las tendencias del mercado! Al ser un cliente de InstaForex, se le proporciona una gran cantidad de servicios gratuitos para una operación eficiente.


