 Rimani
Condizioni di trading
Strumenti


Trend analysis (Fig. 1).
The breakdown of the support line is unlikely. After testing this line, a pullback is possible with the first target 1.1116 - a pullback level of 14.6% (yellow dashed line).
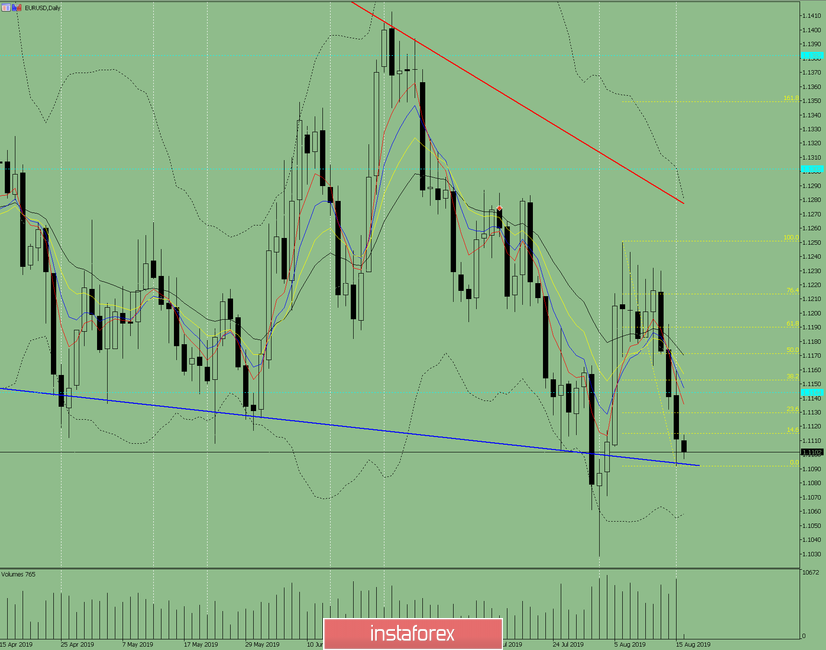
Fig. 1 (daily chart).
Comprehensive analysis:
- indicator analysis - down;
- Fibonacci levels - up;
- volumes - up;
- candlestick analysis - up;
- trend analysis - up;
- Bollinger Lines - down;
- weekly schedule - down.
General conclusion: up.
Low probability scenario - the downward movement will continue with the first target 1.1028 - the lower fractal.
Le recensioni analitiche di InstaForex ti renderanno pienamente consapevole delle tendenze del mercato! Essendo un cliente InstaForex, ti viene fornito un gran numero di servizi gratuiti per il trading efficiente.


