 Permanecer
Condiciones de negociación
Products
Herramientas


Yesterday, the pair moved up and tested the upper fractal 1.1920 (daily candle from 09/11/2020) and then moved downwards, testing the pullback level of 14.6% - 1.1891 (red dotted line). Today, the market may continue to move up. News on the market is not expected today.
Trend analysis (Fig. 1)
Today, from the level of 1.1912 (the closing yesterday's daily candle) the market will try to continue moving up with the target of 1.1947 which is the historical resistance level (blue dotted line). In case of testing this level, work up to the level of 1.2001 which is the upper border of the Bollinger line indicator (black dotted line).
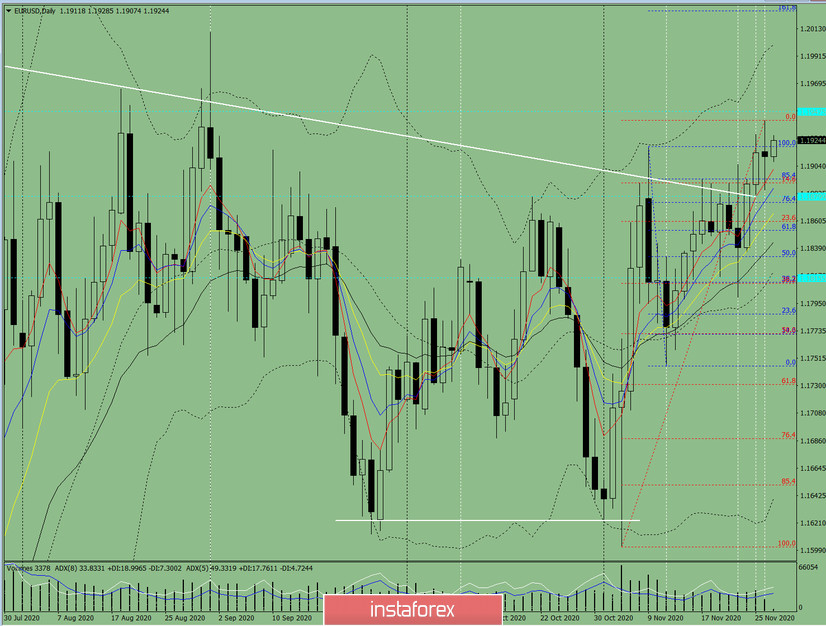
Figure 1 (daily chart)
Complex analysis:
General conclusion:
Today, from the level of 1.1912 (closing yesterday's daily candle), the price will try to continue moving up with the target of 1.1947 which is the historical resistance level (blue dotted line). In case of testing this level, work up to the level of 1.2001 - the upper border of the Bollinger line indicator (black dotted line).
Alternative scenario: When moving up and testing the upper fractal (daily candle from 26/11/2020), the price may start moving down with a target of 1.1891 which is a pullback level of 14.6% (red dotted line).
¡Los informes analíticos de InstaForex lo mantendrá bien informado de las tendencias del mercado! Al ser un cliente de InstaForex, se le proporciona una gran cantidad de servicios gratuitos para una operación eficiente.


