empty
 
 
OPUSZCZASZSTRONĘ INTERNETOWĄ
www.instaforex.eu >
firmy
INSTANT TRADING EU LTD
Otwórz konto

27.11.202009:12 Forex Analysis & Reviews: Indicator analysis. Daily review for the EUR/USD currency pair 27/11/2020

Informacje te są częścią komunikacji marketingowej i są przeznaczone dla klientów detalicznych i profesjonalnych. Informacje te nie zawierają i nie powinny być interpretowane jako informacje zawierające porady inwestycyjne lub rekomendacje dotyczące inwestycji, a także oferty lub zaproszenia do udziału w dowolnej transakcji, lub strategii dotyczącej instrumentów finansowych. Wcześniejsze zyski nie stanowią gwarancji przyszłych dochodów. Instant Trading EU Ltd nie udziela żadnych gwarancji i nie ponosi żadnej odpowiedzialności za dokładność lub kompletność dostarczonych informacji, a także za jakiekolwiek straty wynikające z inwestycji opartych na analizie, prognozie lub innych informacjach dostarczonych przez pracownika Firmy, lub w jakikolwiek inny sposób. Pełne oświadczenie o wyłączeniu odpowiedzialności jest dostępne tutaj.

Yesterday, the pair moved up and tested the upper fractal 1.1920 (daily candle from 09/11/2020) and then moved downwards, testing the pullback level of 14.6% - 1.1891 (red dotted line). Today, the market may continue to move up. News on the market is not expected today.

Trend analysis (Fig. 1)

Today, from the level of 1.1912 (the closing yesterday's daily candle) the market will try to continue moving up with the target of 1.1947 which is the historical resistance level (blue dotted line). In case of testing this level, work up to the level of 1.2001 which is the upper border of the Bollinger line indicator (black dotted line).

Exchange Rates 27.11.2020 analysis

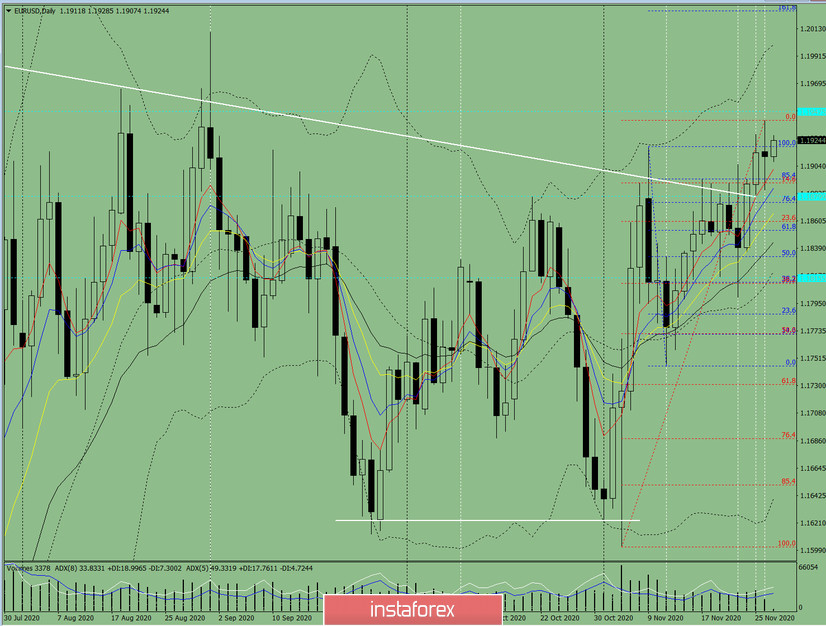
Figure 1 (daily chart)

Complex analysis:

  • Indicator Analysis – up
  • Fibonacci Levels – up
  • Volumes – up
  • Candle Analysis – up
  • Trend Analysis – up
  • Bollinger Bands – up
  • Weekly Chart – up

General conclusion:

Today, from the level of 1.1912 (closing yesterday's daily candle), the price will try to continue moving up with the target of 1.1947 which is the historical resistance level (blue dotted line). In case of testing this level, work up to the level of 1.2001 - the upper border of the Bollinger line indicator (black dotted line).

Alternative scenario: When moving up and testing the upper fractal (daily candle from 26/11/2020), the price may start moving down with a target of 1.1891 which is a pullback level of 14.6% (red dotted line).

Przedstawiono Stefan Doll,
przez eksperta analitycznego
z grupy firm InsaForex © 2007-2024
Otwórz konto handlowe w InstaForex

Dzięki analizom InstaForex zawsze będziesz na bieżące z trendami rynkowymi! Zarejestruj się w InstaForex i uzyskaj dostęp do jeszcze większej liczby bezpłatnych usług dla zyskownego handlu.


Opuszczasz stronę internetową www.instaforex.eu firmy INSTANT TRADING EU LTD
Nie możesz teraz rozmawiać przez telefon?
Zadaj pytanie na czacie.

Turn "Do Not Track" off