 Permanecer
Condiciones de negociación
Products
Herramientas


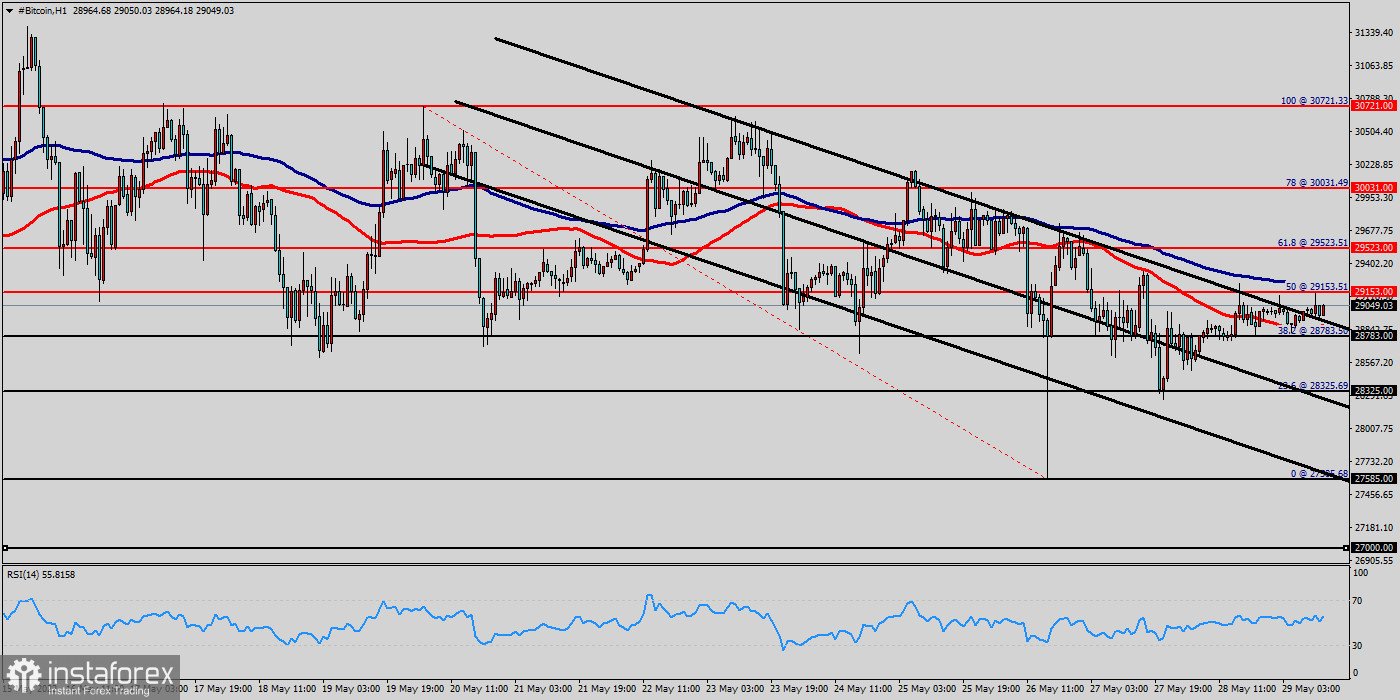
BTC/USD - Bitcoin US Dollar :
Bitcoin is likely to reach $29k before June, 2021, but the bulls must break through $29,153 in order to resume the up trend.
Our dedicated contributors expect a modestly bullish outlook, forecasting price stability after this week's clear rally. The average outlook for the pair was trading above the area of $28k - $29k.
BTC/USD relatively pushes in an uptrend around the recent upper range-line at the price of $29,153 (last bullish wave).
Last week, BTC/USD declines after failing to break the resistance level at 29,153 (top price).
Following the redemanding of the $28,783 support and the clearing of the $29,153 first resistance, BTC/USD price rallied to the psychological price level of $29,153.
The upward move could not be sustained as Bitcoin faces rejection. Bitcoin price is retracing and may find support above $38,219.
On the upside, if the bulls have broken the resistance level ($29,153), the upside momentum would have resumed.
The next target price would have been the $29,523 high. However, as price retraces, it may find support above $28,783 for the continuation of the upward move.
Further close above the high end may cause a rally towards $29,523.
Nonetheless, the weekly resistance level and zone should be considered. Currently, the price is in a bullish channel.
This is confirmed by the RSI indicator signaling that we are still in a bullish trending market. The bias remains bullish in the nearest term testing $29,523 and $30,031.
Immediate resistance is seen around $29,153 levels, which coincides with the weekly pivot. Moreover, the moving average (100) starts signaling an upward trend; therefore, the market is indicating a bullish opportunity above $29,153.
So it will be good to buy at $29,153 with the first target of 29,523. It will also call for a downtrend in order to continue towards $30,031.
The strong weekly support is seen at $28,325. However, if a breakout happens at the support level of $28,325, then this scenario may be invalidated.
¡Los informes analíticos de InstaForex lo mantendrá bien informado de las tendencias del mercado! Al ser un cliente de InstaForex, se le proporciona una gran cantidad de servicios gratuitos para una operación eficiente.

