 Zůstat
Obchodní podmínky
Nástroje


BTC/USD - Bitcoin US Dollar :
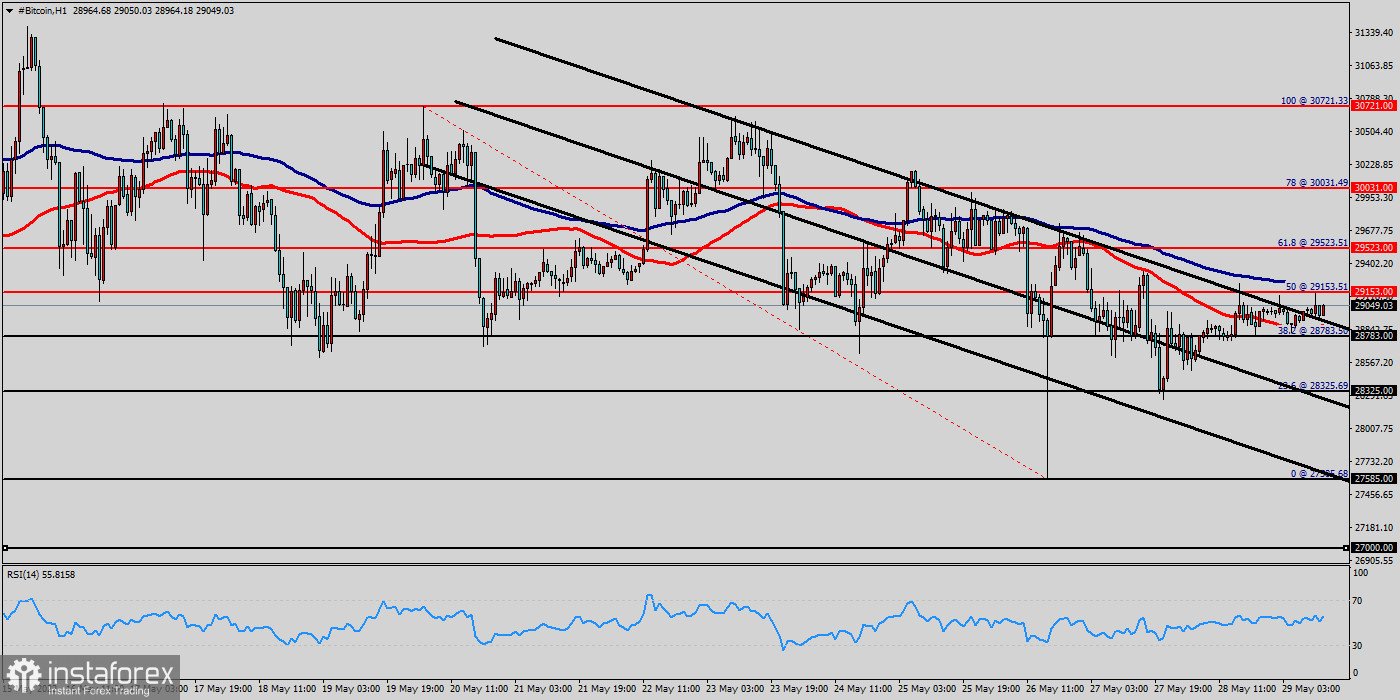
Bitcoin is likely to reach $29k before June, 2021, but the bulls must break through $29,153 in order to resume the up trend.
Our dedicated contributors expect a modestly bullish outlook, forecasting price stability after this week's clear rally. The average outlook for the pair was trading above the area of $28k - $29k.
BTC/USD relatively pushes in an uptrend around the recent upper range-line at the price of $29,153 (last bullish wave).
Last week, BTC/USD declines after failing to break the resistance level at 29,153 (top price).
Following the redemanding of the $28,783 support and the clearing of the $29,153 first resistance, BTC/USD price rallied to the psychological price level of $29,153.
The upward move could not be sustained as Bitcoin faces rejection. Bitcoin price is retracing and may find support above $38,219.
On the upside, if the bulls have broken the resistance level ($29,153), the upside momentum would have resumed.
The next target price would have been the $29,523 high. However, as price retraces, it may find support above $28,783 for the continuation of the upward move.
Further close above the high end may cause a rally towards $29,523.
Nonetheless, the weekly resistance level and zone should be considered. Currently, the price is in a bullish channel.
This is confirmed by the RSI indicator signaling that we are still in a bullish trending market. The bias remains bullish in the nearest term testing $29,523 and $30,031.
Immediate resistance is seen around $29,153 levels, which coincides with the weekly pivot. Moreover, the moving average (100) starts signaling an upward trend; therefore, the market is indicating a bullish opportunity above $29,153.
So it will be good to buy at $29,153 with the first target of 29,523. It will also call for a downtrend in order to continue towards $30,031.
The strong weekly support is seen at $28,325. However, if a breakout happens at the support level of $28,325, then this scenario may be invalidated.
Díky analytickým přehledům společnosti InstaForex získáte plné povědomi o tržních trendech! Jako zákazníkovi společnosti InstaForex je Vám k dispozici velký počet bezplatných služeb umožňujících efektivní obchodování.

