 Permanecer
Condiciones de negociación
Products
Herramientas


The pair moved up on Thursday, almost tested the 21-day EMA at 1.3643 (black thin line), then the price went down, closing the daily candle at 1.3615. Today, the market may roll back down. News is expected at 12:30 UTC (dollar).
Trend analysis (Fig. 1).
The market may move down from the level of 1.3615 (closing of yesterday's daily candle) with the target of 1.3590 - the 23.6% retracement level (blue dotted line). After testing this level, the price may move upward with the target at 1.3660 - the 50.0% retracement level (yellow dashed line). Further upward movement is possible from this level.
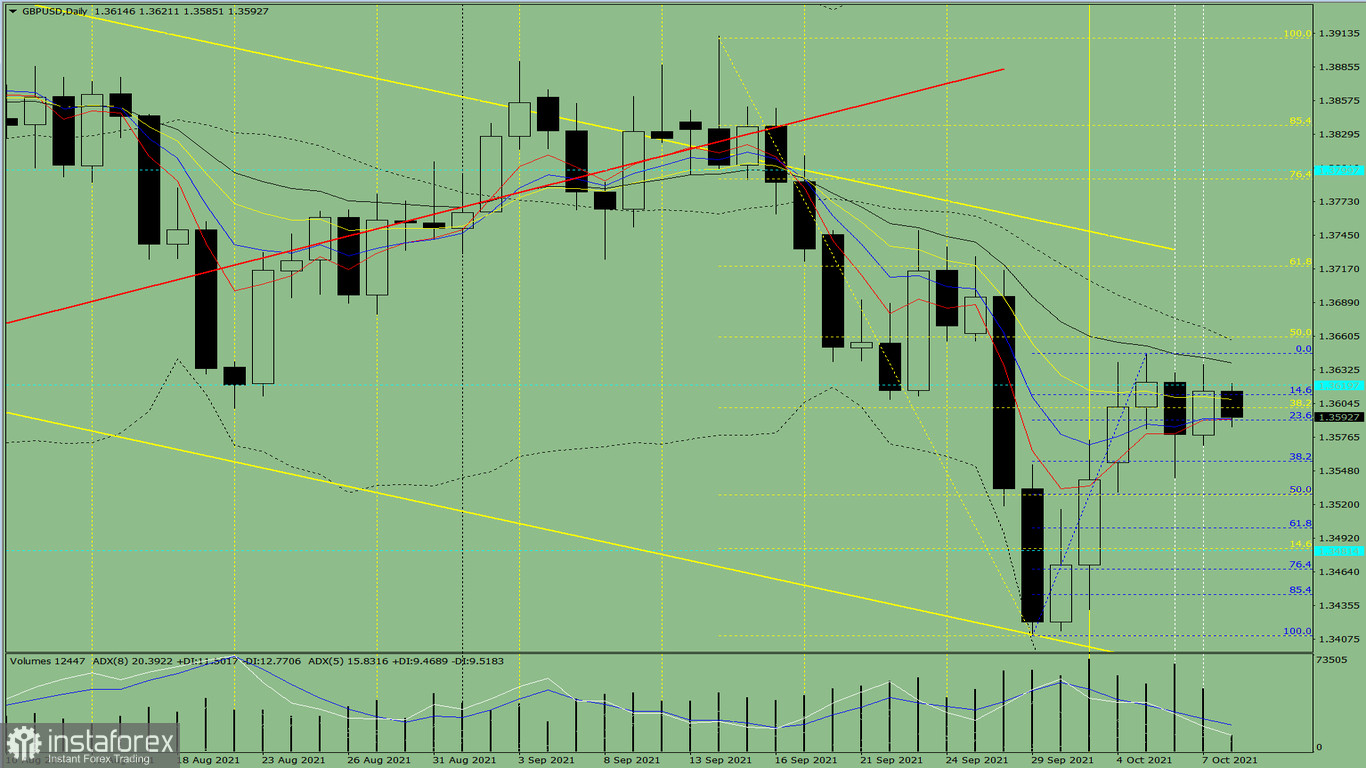
Fig. 1 (daily chart)
Comprehensive analysis:
- Indicator analysis - down;
- Fibonacci levels - down;
- Volumes - down;
- Candlestick analysis - down;
- Trend analysis - up;
- Bollinger lines - up;
- Weekly chart - up.
General conclusion :
Today, the price may move down from the level of 1.3615 (closing of yesterday's daily candle) with the target of 1.3590 - the 23.6% retracement level (blue dotted line). After testing this level, the price may move upward with the target at 1.3660 - the 50.0% retracement level (yellow dashed line). Further upward movement is possible from this level.
Unlikely scenario: from the level of 1.3615 (closing of yesterday's daily candle), the price may continue to move down with the target of 1.3556 - the 38.2% retracement level (blue dotted line). After testing this level, the price may move upward with the target at 1.3620 - the historical resistance level (blue dotted line).
¡Los informes analíticos de InstaForex lo mantendrá bien informado de las tendencias del mercado! Al ser un cliente de InstaForex, se le proporciona una gran cantidad de servicios gratuitos para una operación eficiente.


