 Zůstat
Obchodní podmínky
Nástroje


The pair moved up on Thursday, almost tested the 21-day EMA at 1.3643 (black thin line), then the price went down, closing the daily candle at 1.3615. Today, the market may roll back down. News is expected at 12:30 UTC (dollar).
Trend analysis (Fig. 1).
The market may move down from the level of 1.3615 (closing of yesterday's daily candle) with the target of 1.3590 - the 23.6% retracement level (blue dotted line). After testing this level, the price may move upward with the target at 1.3660 - the 50.0% retracement level (yellow dashed line). Further upward movement is possible from this level.
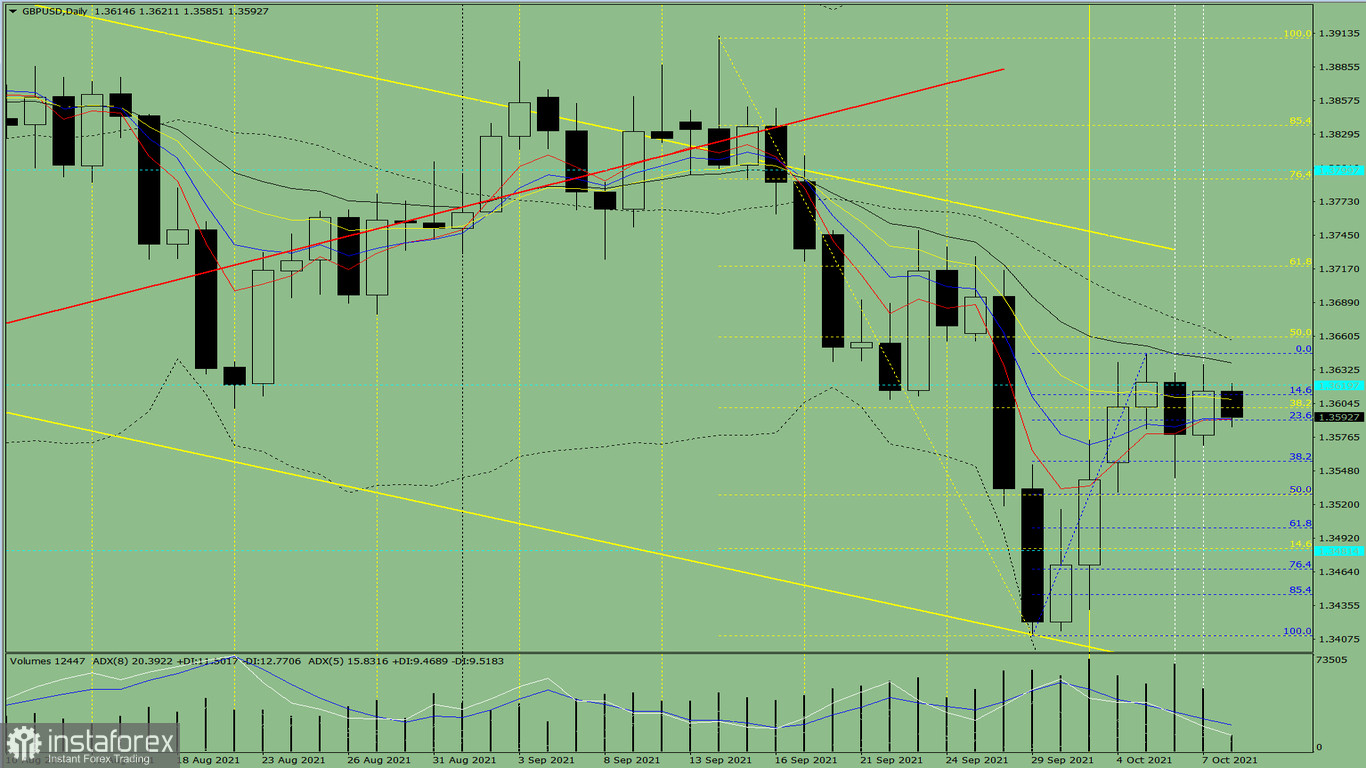
Fig. 1 (daily chart)
Comprehensive analysis:
- Indicator analysis - down;
- Fibonacci levels - down;
- Volumes - down;
- Candlestick analysis - down;
- Trend analysis - up;
- Bollinger lines - up;
- Weekly chart - up.
General conclusion :
Today, the price may move down from the level of 1.3615 (closing of yesterday's daily candle) with the target of 1.3590 - the 23.6% retracement level (blue dotted line). After testing this level, the price may move upward with the target at 1.3660 - the 50.0% retracement level (yellow dashed line). Further upward movement is possible from this level.
Unlikely scenario: from the level of 1.3615 (closing of yesterday's daily candle), the price may continue to move down with the target of 1.3556 - the 38.2% retracement level (blue dotted line). After testing this level, the price may move upward with the target at 1.3620 - the historical resistance level (blue dotted line).
Díky analytickým přehledům společnosti InstaForex získáte plné povědomi o tržních trendech! Jako zákazníkovi společnosti InstaForex je Vám k dispozici velký počet bezplatných služeb umožňujících efektivní obchodování.


