 Permanecer
Condiciones de negociación
Products
Herramientas

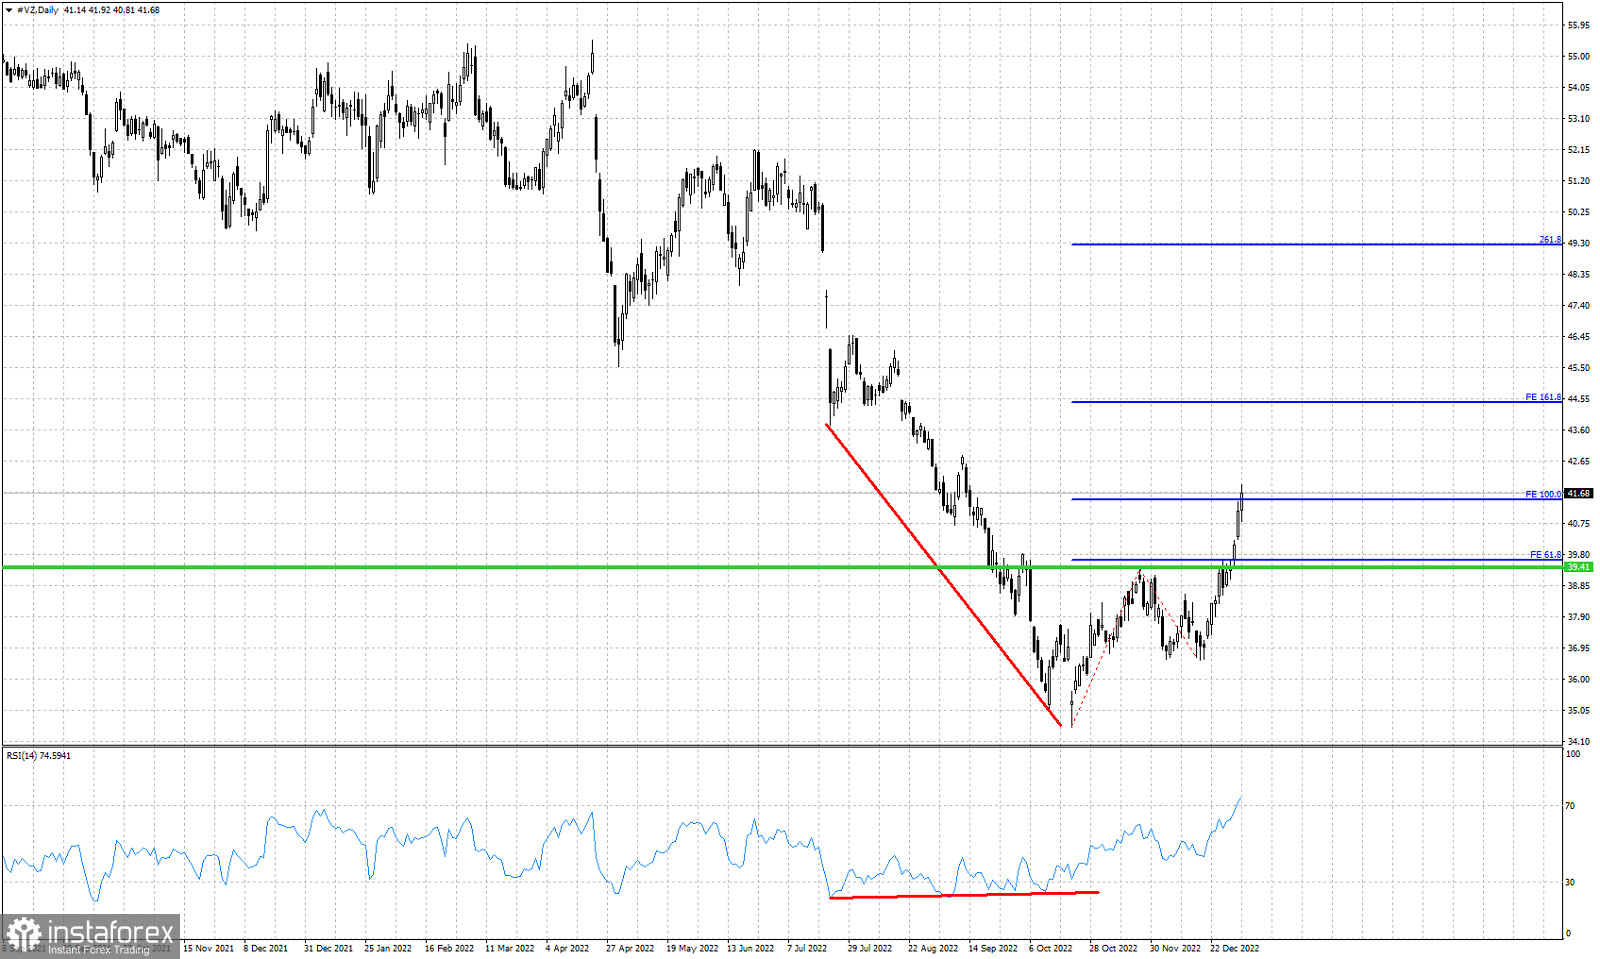
Green line -horizontal resistance (broken)
Red lines- bullish divergence
Blue lines- Fibonacci extension targets
In our last analysis on VZ stock price we noted that there was a bullish pattern in play. We mentioned that a break above the horizontal resistance of $39.40-$39.50 would be a bullish signal with $41.45 the first target. After the break out our 100% extension target has been reached. Support remains key at $36.57 and as long as we trade above this level, bulls have hopes for higher highs. Previous resistance at $39.50 is now support. It would be a sign of weakness if price were to break back below this level. Traders who entered long when price broke above the $39.50 resistance, should protect their positions at break even.
¡Los informes analíticos de InstaForex lo mantendrá bien informado de las tendencias del mercado! Al ser un cliente de InstaForex, se le proporciona una gran cantidad de servicios gratuitos para una operación eficiente.


