 Rimani
Condizioni di trading
Strumenti

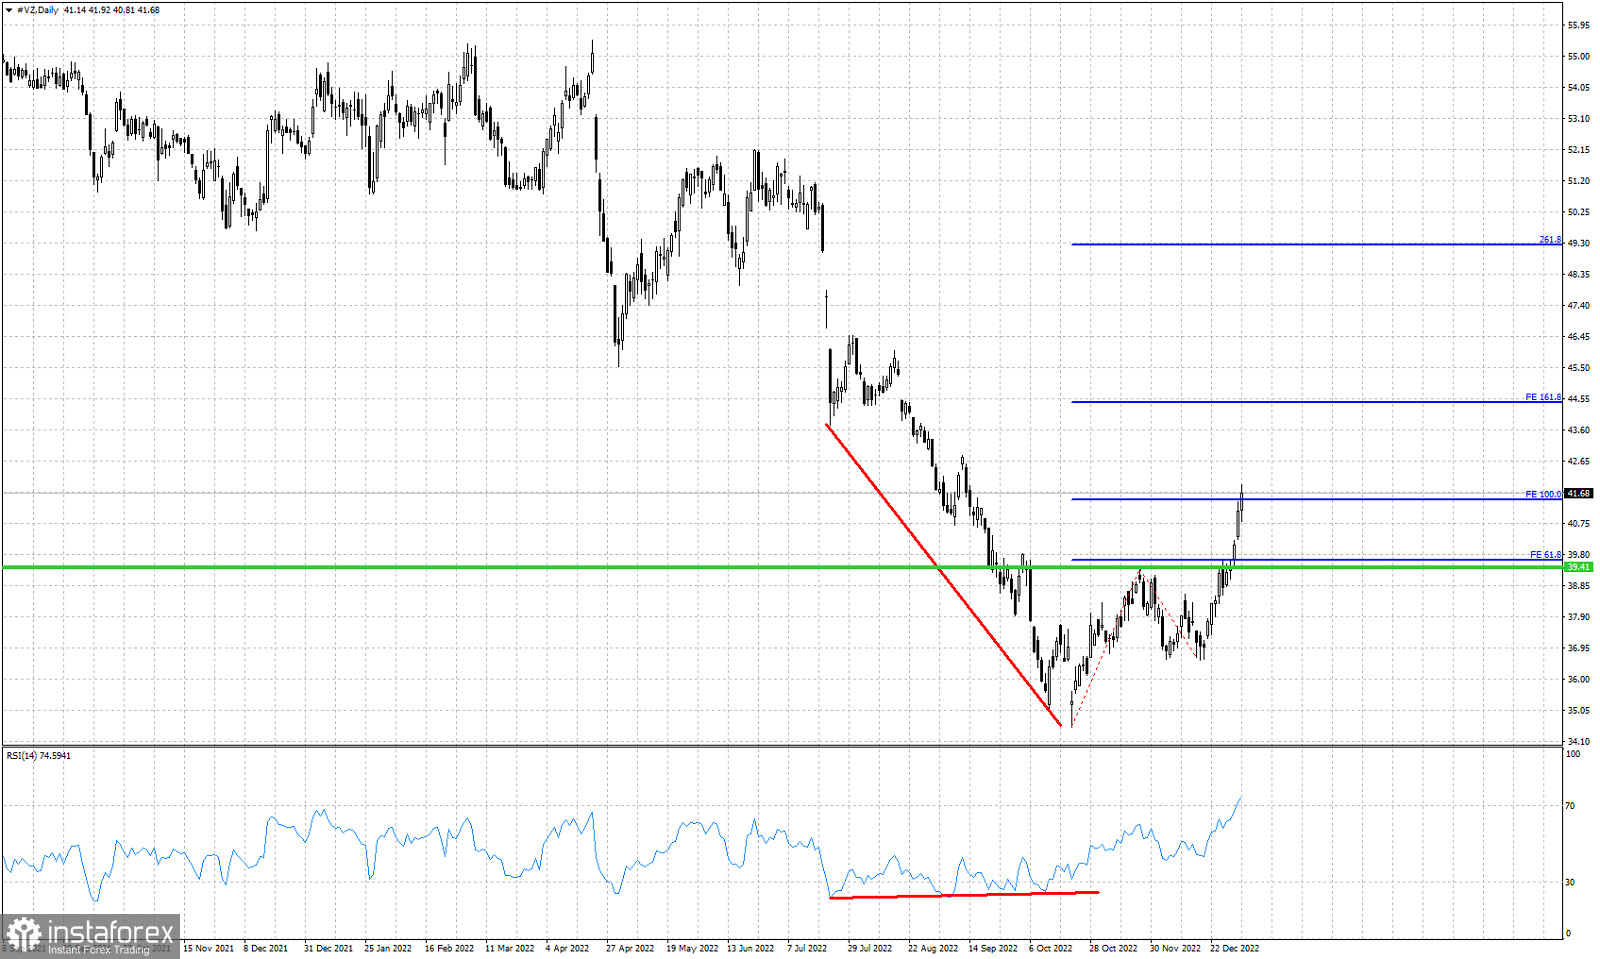
Green line -horizontal resistance (broken)
Red lines- bullish divergence
Blue lines- Fibonacci extension targets
In our last analysis on VZ stock price we noted that there was a bullish pattern in play. We mentioned that a break above the horizontal resistance of $39.40-$39.50 would be a bullish signal with $41.45 the first target. After the break out our 100% extension target has been reached. Support remains key at $36.57 and as long as we trade above this level, bulls have hopes for higher highs. Previous resistance at $39.50 is now support. It would be a sign of weakness if price were to break back below this level. Traders who entered long when price broke above the $39.50 resistance, should protect their positions at break even.
Le recensioni analitiche di InstaForex ti renderanno pienamente consapevole delle tendenze del mercato! Essendo un cliente InstaForex, ti viene fornito un gran numero di servizi gratuiti per il trading efficiente.


