 Permanecer
Condiciones de negociación
Products
Herramientas


Trend analysis (Fig. 1).
On Monday, the price may go down from 0.9963 (closing level of the Friday daily candlestick) to the lower fracts of 0.9900 (white dotted line) and test it. The price may then rise, test the 14.6% retracement level of 0.9967 (white dotted line), and continue to increase.
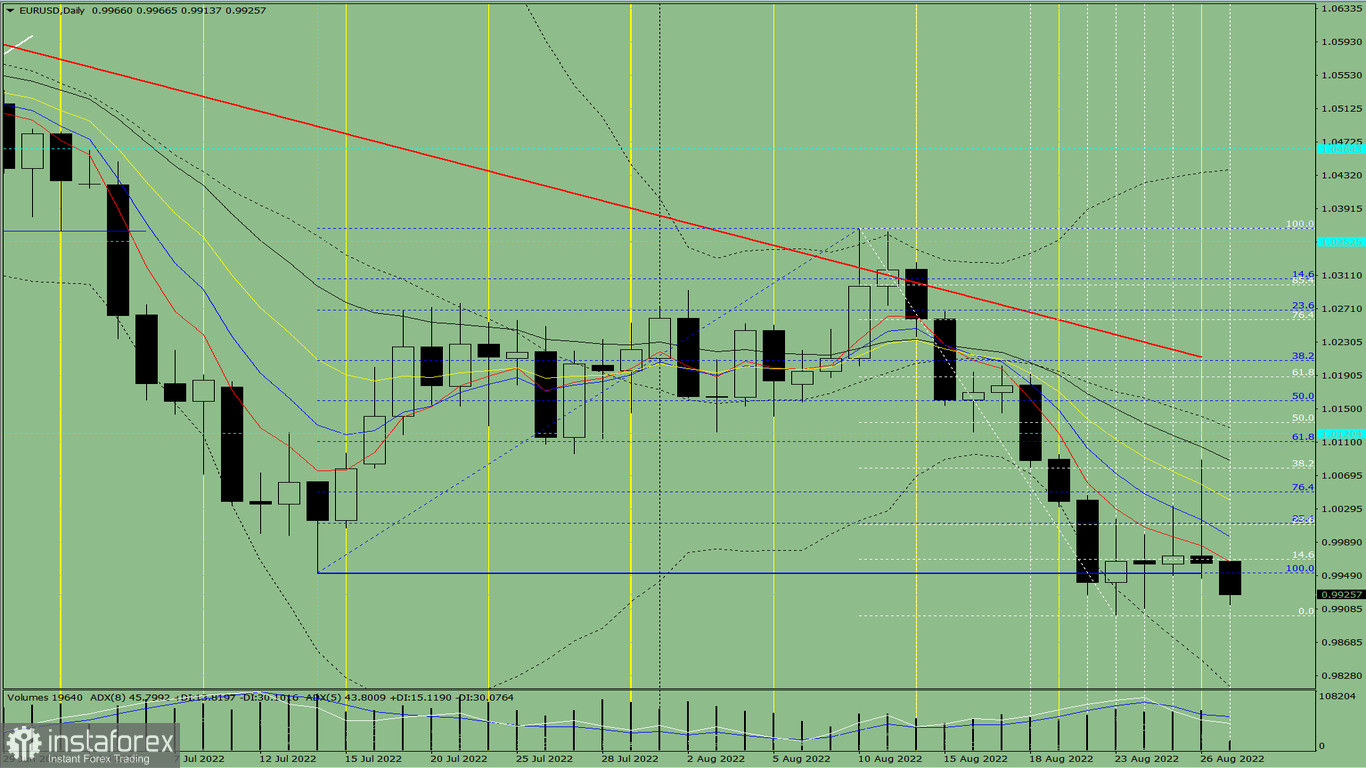
Fig. 1 (daily chart).
Complex analysis:
- indicator analysis - down;
- Fibonacci levels - down;
- volumes - down;
- candlestick analysis - down;
- trend analysis - down;
- Bollinger bands - up;
- weekly chart down.
Conclusion:
Today, the price may go down from 0.9963 (closing level of the Friday daily candlestick) to the lower fracts of 0.9900 (white dotted line) and test it. The price may then rise, test the 14.6% retracement level of 0.9967 (white dotted line), and continue to increase.
Alternative scenario: the price may go down from 0.9963 (closing level of the Friday daily candlestick), test the lower Bollinger band at 0.9815 (black dotted line), and rise to the lower fractal of 0.9900 (white dotted line). The quote may then extend growth to the 14.6% retracement level of 0.9967 (white dotted line).
¡Los informes analíticos de InstaForex lo mantendrá bien informado de las tendencias del mercado! Al ser un cliente de InstaForex, se le proporciona una gran cantidad de servicios gratuitos para una operación eficiente.


