 Zostať
Podmienky obchodovania
Nástroje


Trend analysis (Fig. 1).
On Monday, the price may go down from 0.9963 (closing level of the Friday daily candlestick) to the lower fracts of 0.9900 (white dotted line) and test it. The price may then rise, test the 14.6% retracement level of 0.9967 (white dotted line), and continue to increase.
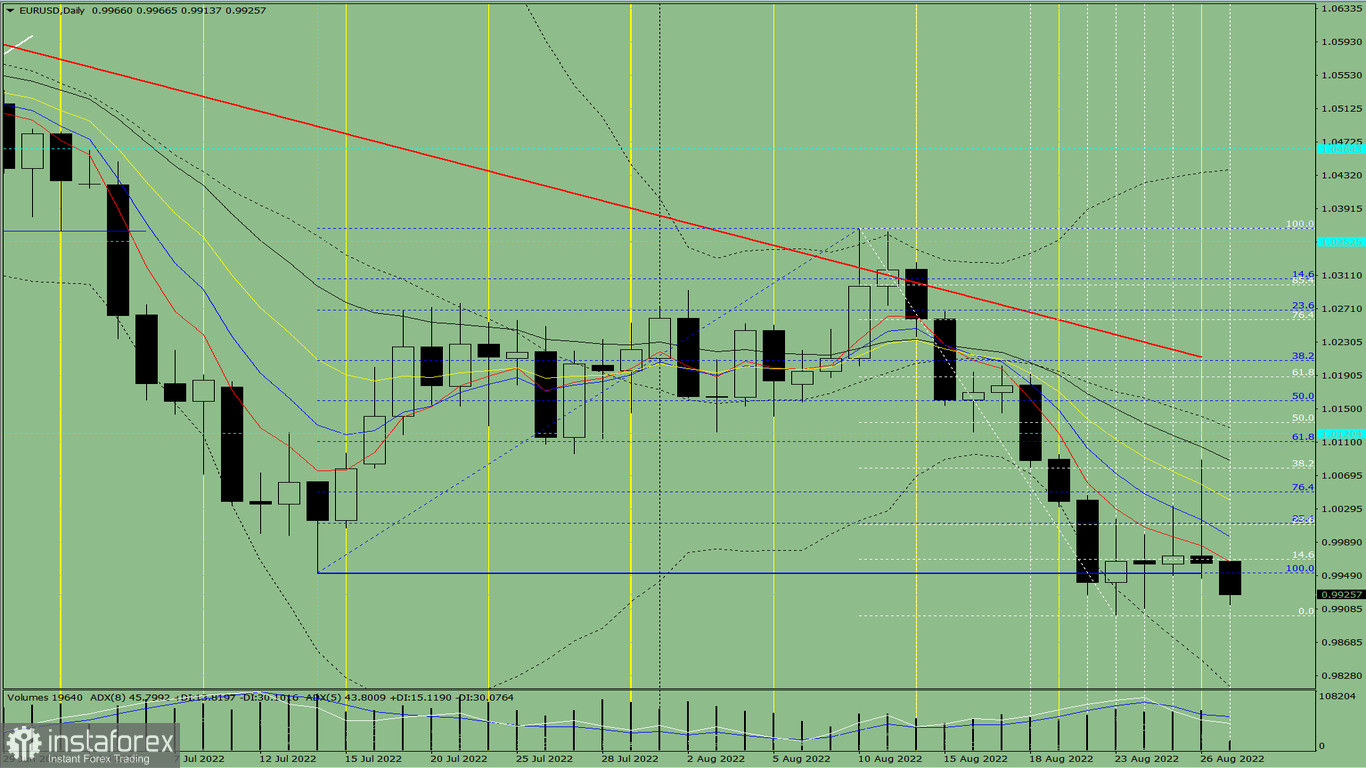
Fig. 1 (daily chart).
Complex analysis:
- indicator analysis - down;
- Fibonacci levels - down;
- volumes - down;
- candlestick analysis - down;
- trend analysis - down;
- Bollinger bands - up;
- weekly chart down.
Conclusion:
Today, the price may go down from 0.9963 (closing level of the Friday daily candlestick) to the lower fracts of 0.9900 (white dotted line) and test it. The price may then rise, test the 14.6% retracement level of 0.9967 (white dotted line), and continue to increase.
Alternative scenario: the price may go down from 0.9963 (closing level of the Friday daily candlestick), test the lower Bollinger band at 0.9815 (black dotted line), and rise to the lower fractal of 0.9900 (white dotted line). The quote may then extend growth to the 14.6% retracement level of 0.9967 (white dotted line).
InstaForex analytical reviews will make you fully aware of market trends! Being an InstaForex client, you are provided with a large number of free services for efficient trading.

