 Permanecer
Condiciones de negociación
Products
Herramientas


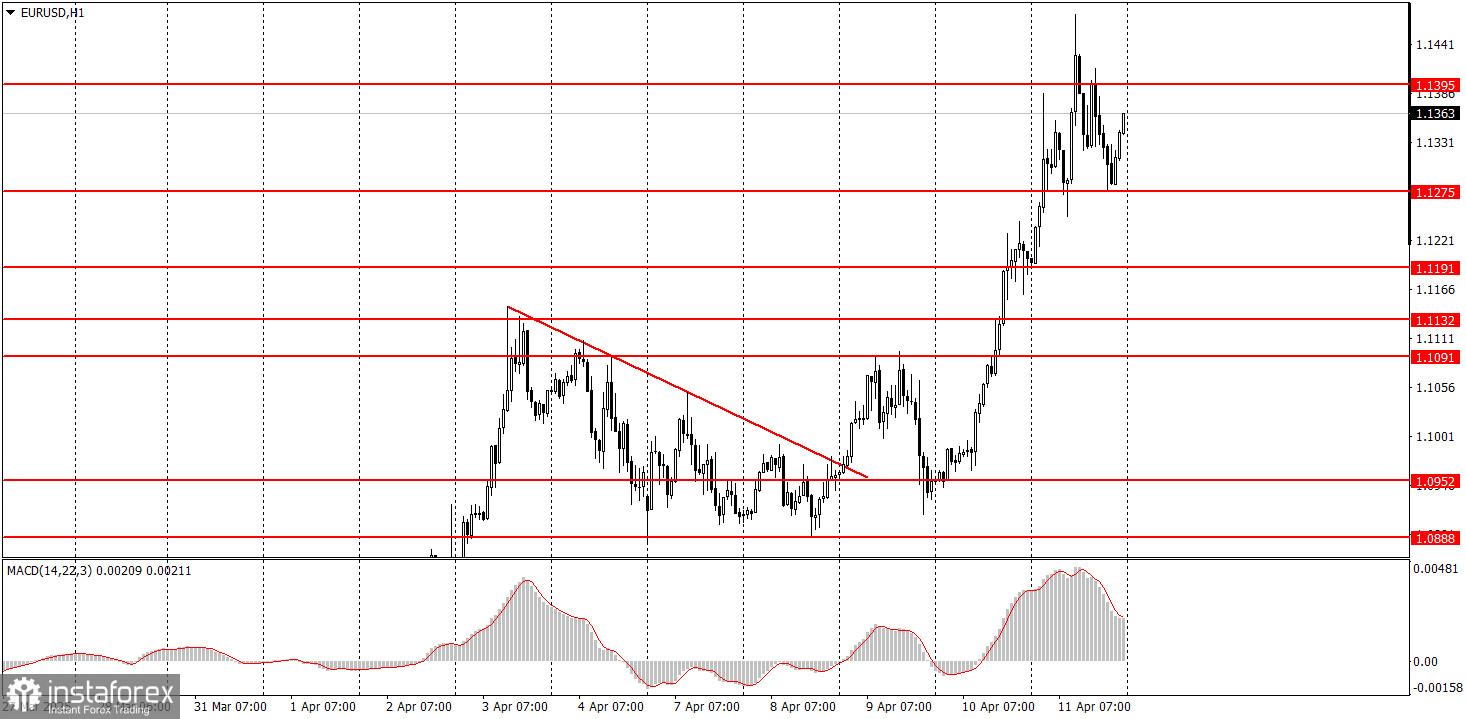
On Friday, the EUR/USD currency pair generally continued upward movement. And why would it stop? The trade war between the U.S. and China continues to escalate, with the two countries imposing new tariffs and sanctions on each other almost daily. For instance, on Friday, it was revealed that the U.S. raised tariffs on Chinese imports to 145%, while China responded with tariffs of 125% on U.S. imports. And we're certain that Beijing hasn't yet had time to react to Washington's most recent tariff hike. Therefore, we can expect Chinese tariffs to reach a "mirrored" 145%. As the trade war intensifies—and considering it was triggered by Trump—the world continues to boycott the dollar, American stocks and bonds, and investment in the U.S. That's why the dollar is essentially in free fall while the macroeconomic backdrop is practically irrelevant.
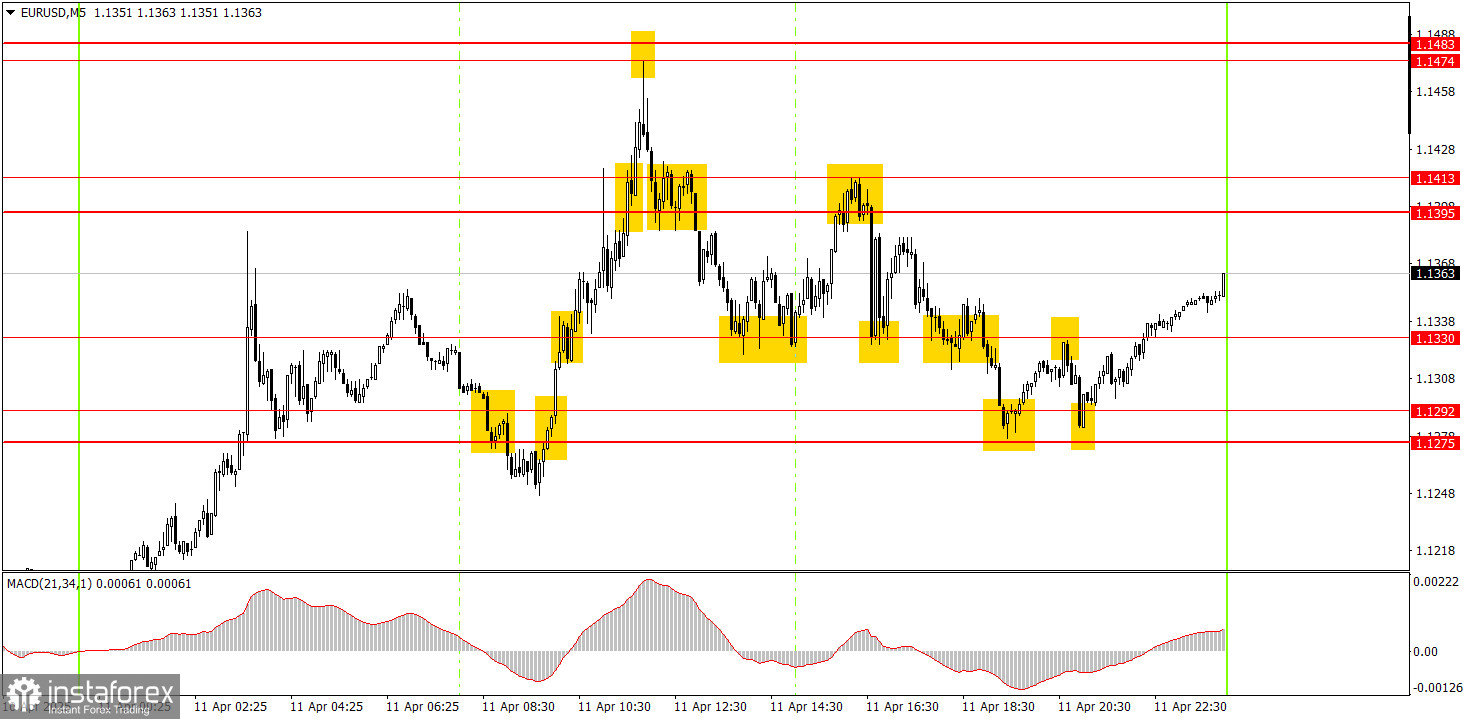
On the 5-minute timeframe Friday, a huge number of trading signals were generated, and the price reversed direction at least six times during the day. We've said many times that panic and chaos currently dominate the market, so if you do trade, extreme caution is essential. On Friday, there were only 13 trade signals formed in total. You could technically respond to any of them with this kind of price action.
The EUR/USD pair on the hourly chart remains in an upward trend. It is unknown how long this will continue, as no one knows how many additional tariffs Trump might introduce. Repeated escalation of the trade war is entirely possible, as many countries are preparing mirrored responses to the U.S.—something the American president is unlikely to welcome. Due to Trump's selective tariff relief measures, the dollar has failed to strengthen, as the spotlight remains on the U.S.–China trade conflict.
On Monday, markets will likely remain in a state of shock. We won't attempt to predict price movements because news about the trade war emerges almost every two hours. What's happening right now across global markets is challenging to put into words.
In the 5-minute timeframe, monitor the following levels: 1.0797–1.0804, 1.0859–1.0861, 1.0888–1.0896, 1.0940–1.0952, 1.1011, 1.1091, 1.1132–1.1140, 1.1189–1.1191, 1.1275–1.1292, 1.1330, 1.1395–1.1413, 1.1474–1.1483.
No significant events are scheduled for Monday in either the Eurozone or the U.S., but the market has been trading exclusively on the trade war factor for a couple of months. News about new tariffs never arrives on schedule, so don't count on a "quiet Monday."
Support and Resistance Levels: These are target levels for opening or closing positions and can also serve as points for placing Take Profit orders.
Red Lines: Channels or trendlines indicating the current trend and the preferred direction for trading.
MACD Indicator (14,22,3): A histogram and signal line used as a supplementary source of trading signals.
Important Events and Reports: Found in the economic calendar, these can heavily influence price movements. Exercise caution or exit the market during their release to avoid sharp reversals.
Forex trading beginners should remember that not every trade will be profitable. Developing a clear strategy and practicing proper money management are essential for long-term trading success.
¡Los informes analíticos de InstaForex lo mantendrá bien informado de las tendencias del mercado! Al ser un cliente de InstaForex, se le proporciona una gran cantidad de servicios gratuitos para una operación eficiente.


