 Permanecer
Condiciones de negociación
Products
Herramientas


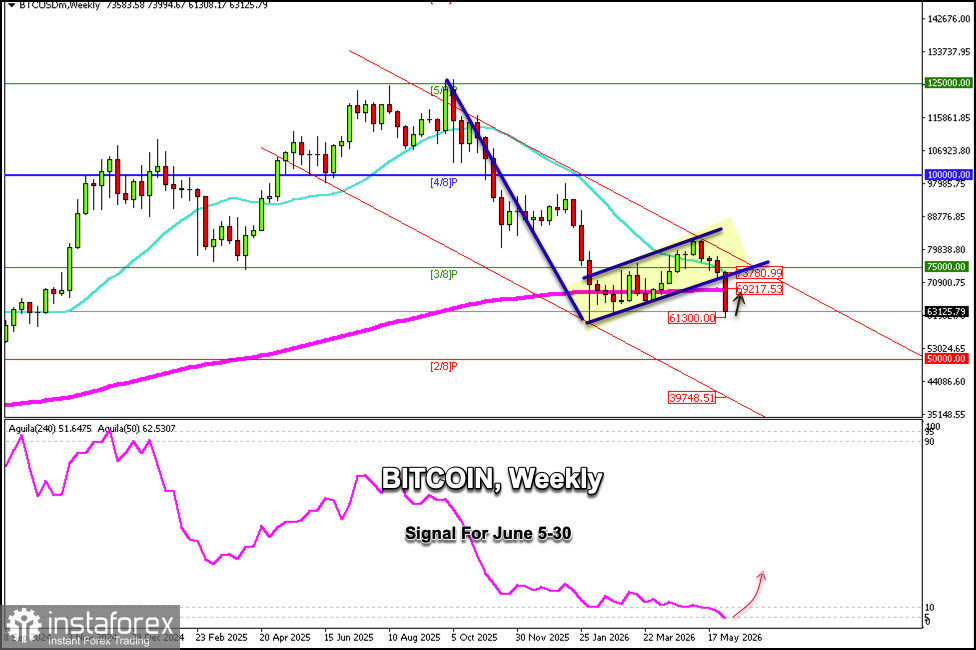
The weekly Bitcoin chart indicates a bearish trend for the coming months. This development could take 2 to 6 months, lasting until the end of the year, for the price to reach the 2/8 Murray level around the psychological threshold of $50,000; even if bearish pressure persists, it could drop to $39,700.
During today's Asian session, we saw a sharp drop in Bitcoin, reaching a low of $61,300.
BTC is currently trading around $63,125 and is likely to continue rising in the coming days until it reaches the 200 EMA around $69,217; if bullish momentum prevails, we could expect it to reach the strong 3/8 Murray resistance level around $75,000.
Technically, Bitcoin has reached oversold levels. Thus, above $61,500, any pullback will be seen as a buying opportunity in the coming days, with targets around $65,000 and ultimately around $69,200.
Bitcoin could resume its bearish cycle if it encounters strong resistance around $69,000 or $73,800. We must remain vigilant regarding Bitcoin's price movement. Should it reach these resistance levels, it could be considered a good point to open short positions.
Our trading plan for the coming hours is to buy Bitcoin from current price levels above $61,500, with targets at $70,000.
The weekly chart shows a sharp break below the uptrend channel that has been forming since January 25. Therefore, a pullback is expected here in the coming days toward $73,500, before resuming its bearish cycle and thus confirming the bearish pennant pattern. BTC has the potential to reach the psychological level of $50,000 and even $40,000 over the coming months.
¡Los informes analíticos de InstaForex lo mantendrá bien informado de las tendencias del mercado! Al ser un cliente de InstaForex, se le proporciona una gran cantidad de servicios gratuitos para una operación eficiente.


