 Stay
Stay 
Trading Conditions
Products
Tools


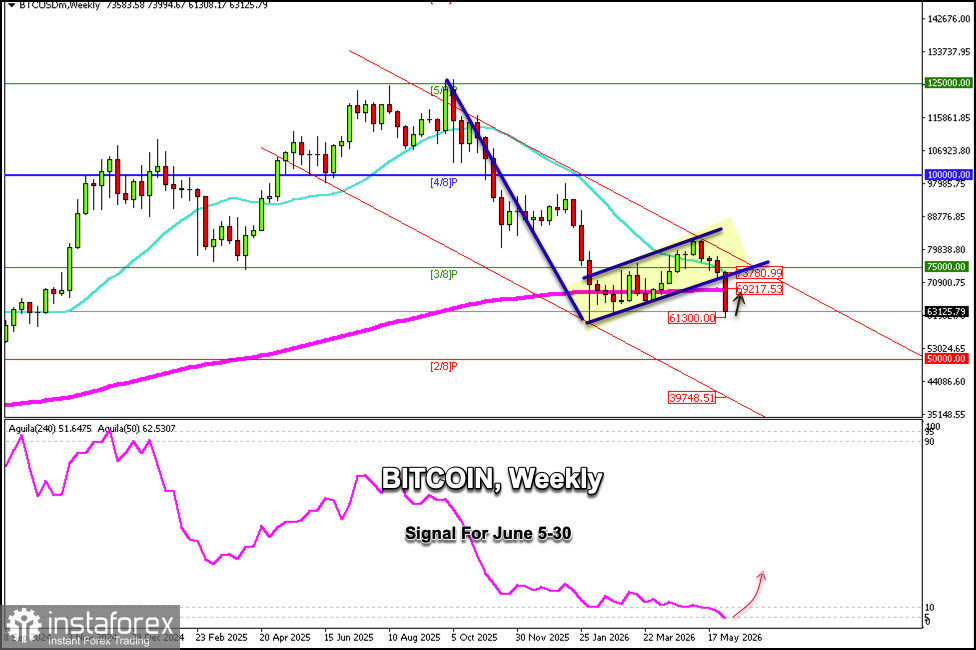
The weekly Bitcoin chart indicates a bearish trend for the coming months. This development could take 2 to 6 months, lasting until the end of the year, for the price to reach the 2/8 Murray level around the psychological threshold of $50,000; even if bearish pressure persists, it could drop to $39,700.
During today's Asian session, we saw a sharp drop in Bitcoin, reaching a low of $61,300.
BTC is currently trading around $63,125 and is likely to continue rising in the coming days until it reaches the 200 EMA around $69,217; if bullish momentum prevails, we could expect it to reach the strong 3/8 Murray resistance level around $75,000.
Technically, Bitcoin has reached oversold levels. Thus, above $61,500, any pullback will be seen as a buying opportunity in the coming days, with targets around $65,000 and ultimately around $69,200.
Bitcoin could resume its bearish cycle if it encounters strong resistance around $69,000 or $73,800. We must remain vigilant regarding Bitcoin's price movement. Should it reach these resistance levels, it could be considered a good point to open short positions.
Our trading plan for the coming hours is to buy Bitcoin from current price levels above $61,500, with targets at $70,000.
The weekly chart shows a sharp break below the uptrend channel that has been forming since January 25. Therefore, a pullback is expected here in the coming days toward $73,500, before resuming its bearish cycle and thus confirming the bearish pennant pattern. BTC has the potential to reach the psychological level of $50,000 and even $40,000 over the coming months.
InstaForex analytical reviews will make you fully aware of market trends! Being an InstaForex client, you are provided with a large number of free services for efficient trading.


