 Permanecer
Condiciones de negociación
Products
Herramientas


This week, the price may begin a downward movement from the 1.3435 level (close of the last weekly candle), targeting 1.3269 – a historical support level (blue dashed line). Upon testing this level, the price may initiate an upward correction toward 1.3410 – the 21-period EMA (thin black line).
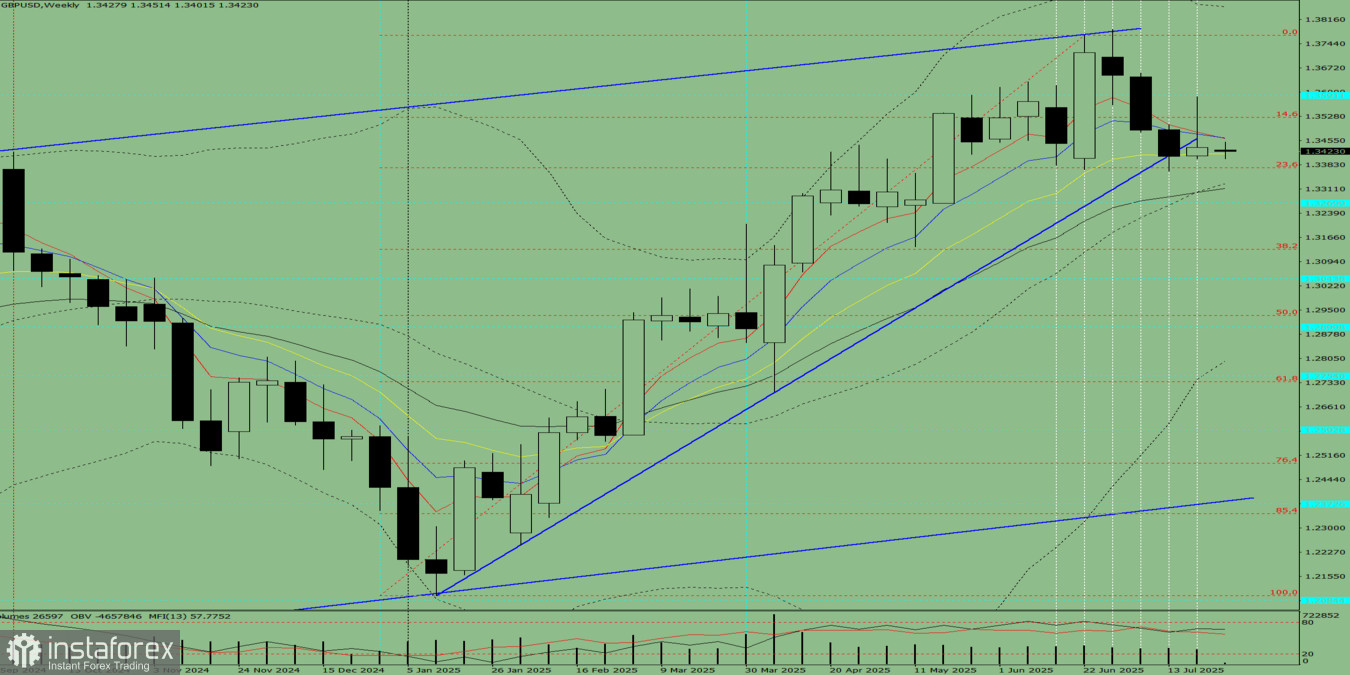
Figure 1 (Weekly Chart)
Conclusion from the Comprehensive Analysis: downward movement.
The price is most likely to trend downward throughout the week, with the weekly black candle lacking an upper shadow (Monday – down), and forming a lower shadow (Friday – up).
The price may begin to move downward from the 1.3435 level (close of the last weekly candle), targeting 1.3131 – the 38.2% retracement level (red dashed line). Upon reaching this level, an upward movement may follow, targeting 1.3270 – a historical support level (blue dashed line).
¡Los informes analíticos de InstaForex lo mantendrá bien informado de las tendencias del mercado! Al ser un cliente de InstaForex, se le proporciona una gran cantidad de servicios gratuitos para una operación eficiente.


