 Zůstat
Obchodní podmínky
Nástroje

This week, the price may begin a downward movement from the 1.3435 level (close of the last weekly candle), targeting 1.3269 – a historical support level (blue dashed line). Upon testing this level, the price may initiate an upward correction toward 1.3410 – the 21-period EMA (thin black line).
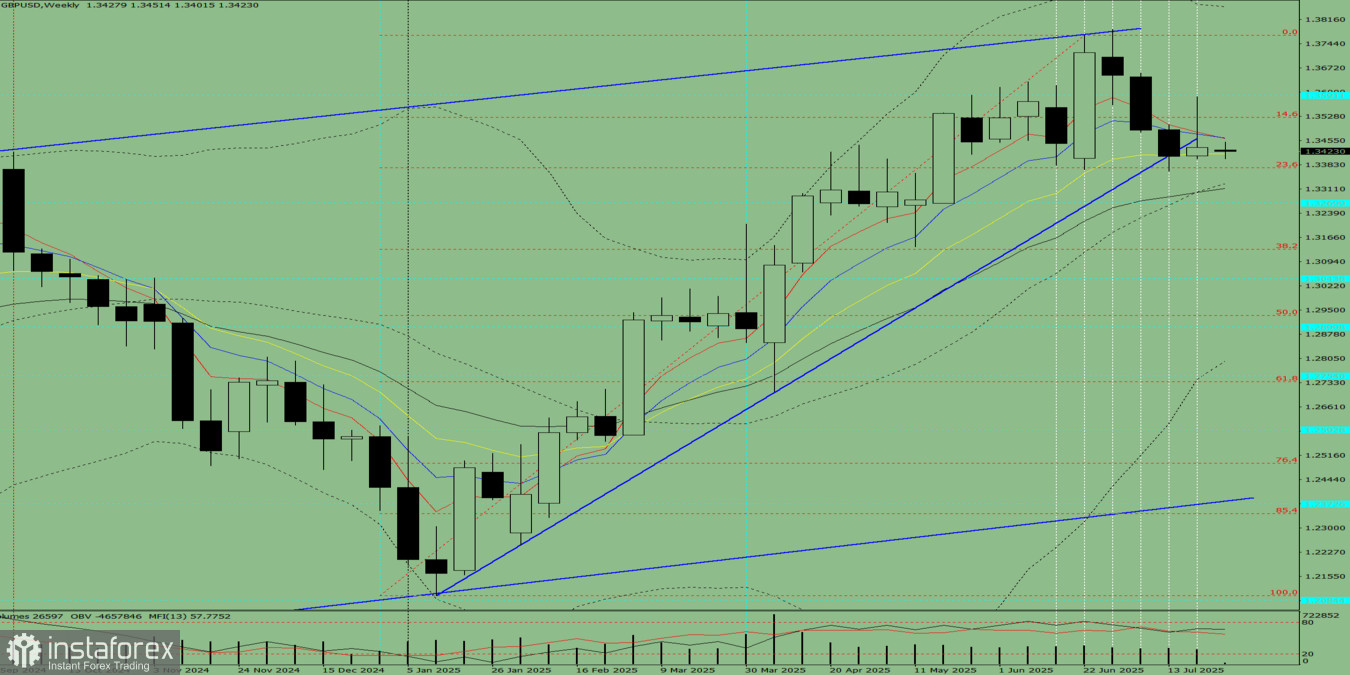
Figure 1 (Weekly Chart)
Conclusion from the Comprehensive Analysis: downward movement.
The price is most likely to trend downward throughout the week, with the weekly black candle lacking an upper shadow (Monday – down), and forming a lower shadow (Friday – up).
The price may begin to move downward from the 1.3435 level (close of the last weekly candle), targeting 1.3131 – the 38.2% retracement level (red dashed line). Upon reaching this level, an upward movement may follow, targeting 1.3270 – a historical support level (blue dashed line).
Díky analytickým přehledům společnosti InstaForex získáte plné povědomi o tržních trendech! Jako zákazníkovi společnosti InstaForex je Vám k dispozici velký počet bezplatných služeb umožňujících efektivní obchodování.


