 Permanecer
Condiciones de negociación
Products
Herramientas


On Thursday, the GBP/USD pair spent nearly the entire day in a narrow range, showing minimal volatility. Even the US GDP report for the second quarter (second estimate) didn't help the US dollar. As we predicted, the market largely ignored this report, as the second estimate is the least significant of all. So, although the US economy grew by 3.3%, everyone understands what kind of growth that is and what it means. In our view, first, the flat could continue for both the euro and the pound. Second, the dollar still has no grounds for medium-term growth. There is not a single event on the horizon that could hypothetically support the US currency. On Friday, the macroeconomic backdrop is expected to remain weak, despite a fair number of reports scheduled throughout the day. However, traders clearly intend to wait for new inflation and labor market data from the US to make a more accurate forecast for the September 17 FOMC meeting.
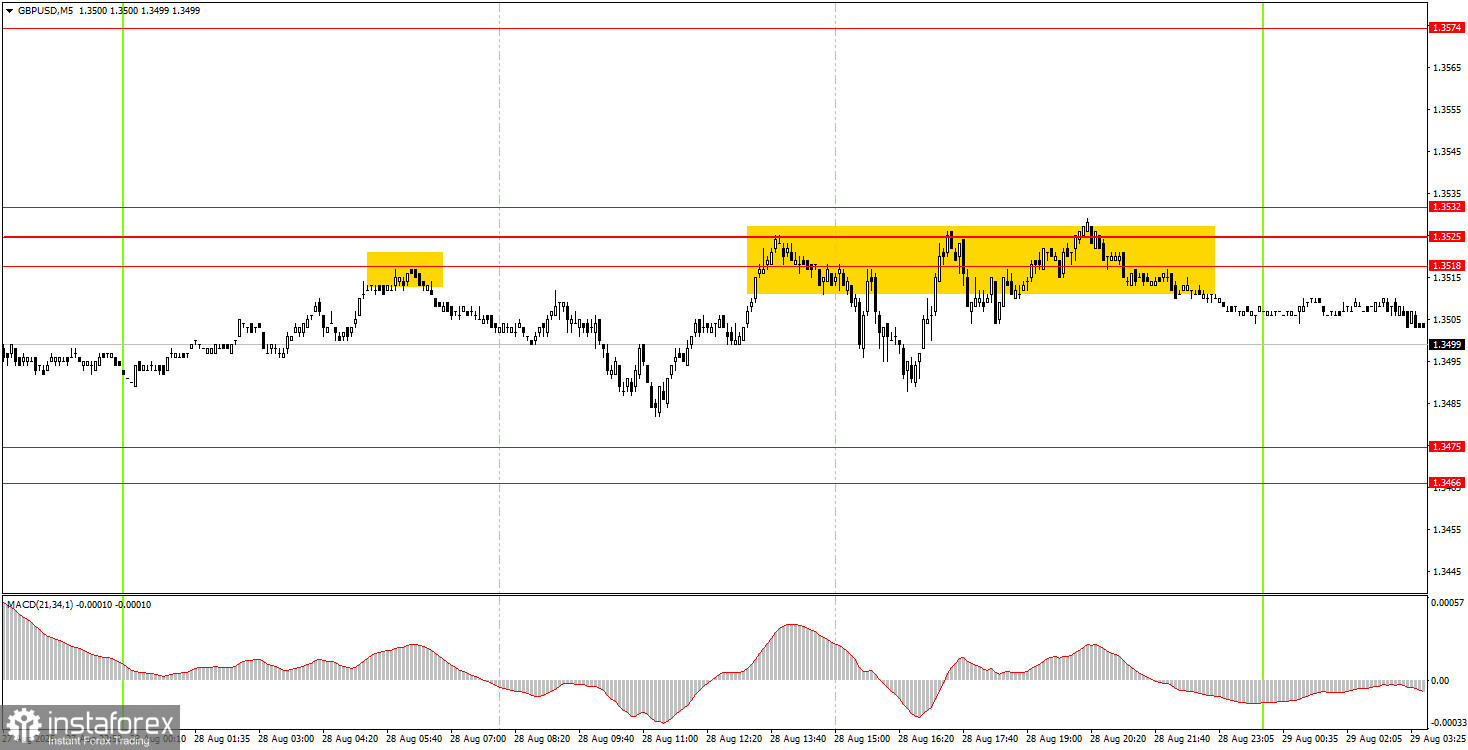
On the 5-minute timeframe, four identical trading signals were generated on Thursday. The pair bounced four times from the 1.3518–1.3532 area, which can be considered the upper boundary of the sideways channel. We haven't seen any strong downward movement, but the signals weren't false or losing, either. Thus, a further decline could well continue today.
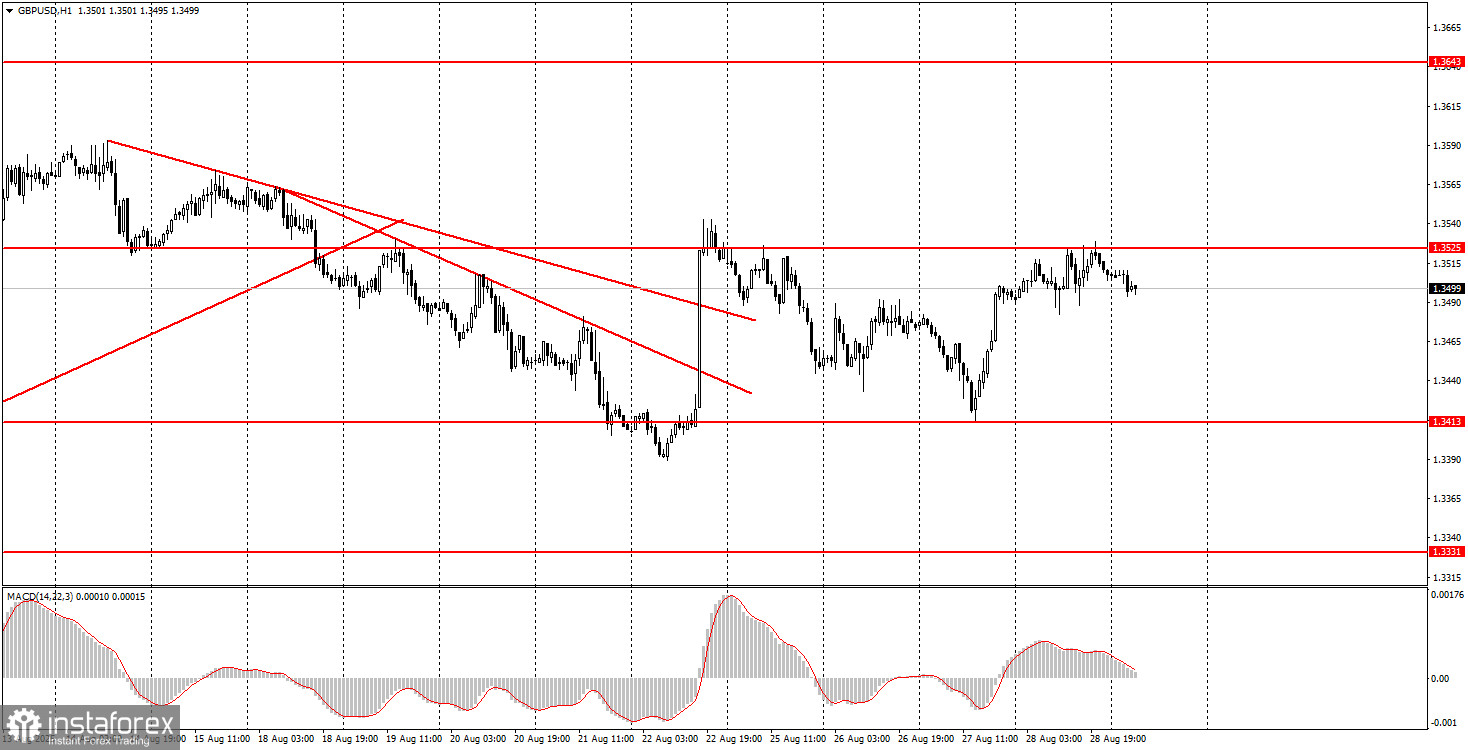
On the hourly timeframe, the GBP/USD pair indicates that the downward trend has ended and a new upward trend is emerging. Neither the fundamental nor macroeconomic background has become more attractive for the dollar to warrant a stronger appreciation. Thus, as before, we are only looking at the upside. Any news of an escalation in the trade war, de-escalation in Ukraine, or Trump putting pressure on the Fed will signal a potential new drop for the US currency.
On Friday, the GBP/USD pair could start a new wave of decline, as the price bounced four times from the 1.3518–1.3532 area. At the same time, a break above this area is more likely and would allow for new long positions with a target of 1.3574–1.3590.
On the 5-minute timeframe, you can currently trade using the following levels: 1.3102–1.3107, 1.3203–1.3211, 1.3259, 1.3329–1.3331, 1.3413–1.3421, 1.3466–1.3475, 1.3518–1.3532, 1.3574–1.3590, 1.3643–1.3652, 1.3682, 1.3763.
For Friday, there are no important data releases or events planned in the UK. In the US, the PCE and consumer sentiment indices will be published, along with data on personal income and spending.
Support and Resistance Levels: These are target levels for opening or closing positions and can also serve as points for placing Take Profit orders.
Red Lines: Channels or trendlines indicating the current trend and the preferred direction for trading.
MACD Indicator (14,22,3): A histogram and signal line used as a supplementary source of trading signals.
Important Events and Reports: Found in the economic calendar, these can heavily influence price movements. Exercise caution or exit the market during their release to avoid sharp reversals.
Forex trading beginners should remember that not every trade will be profitable. Developing a clear strategy and practicing proper money management are essential for long-term trading success.
¡Los informes analíticos de InstaForex lo mantendrá bien informado de las tendencias del mercado! Al ser un cliente de InstaForex, se le proporciona una gran cantidad de servicios gratuitos para una operación eficiente.


