 Permanecer

Condiciones de negociación
Products
Herramientas


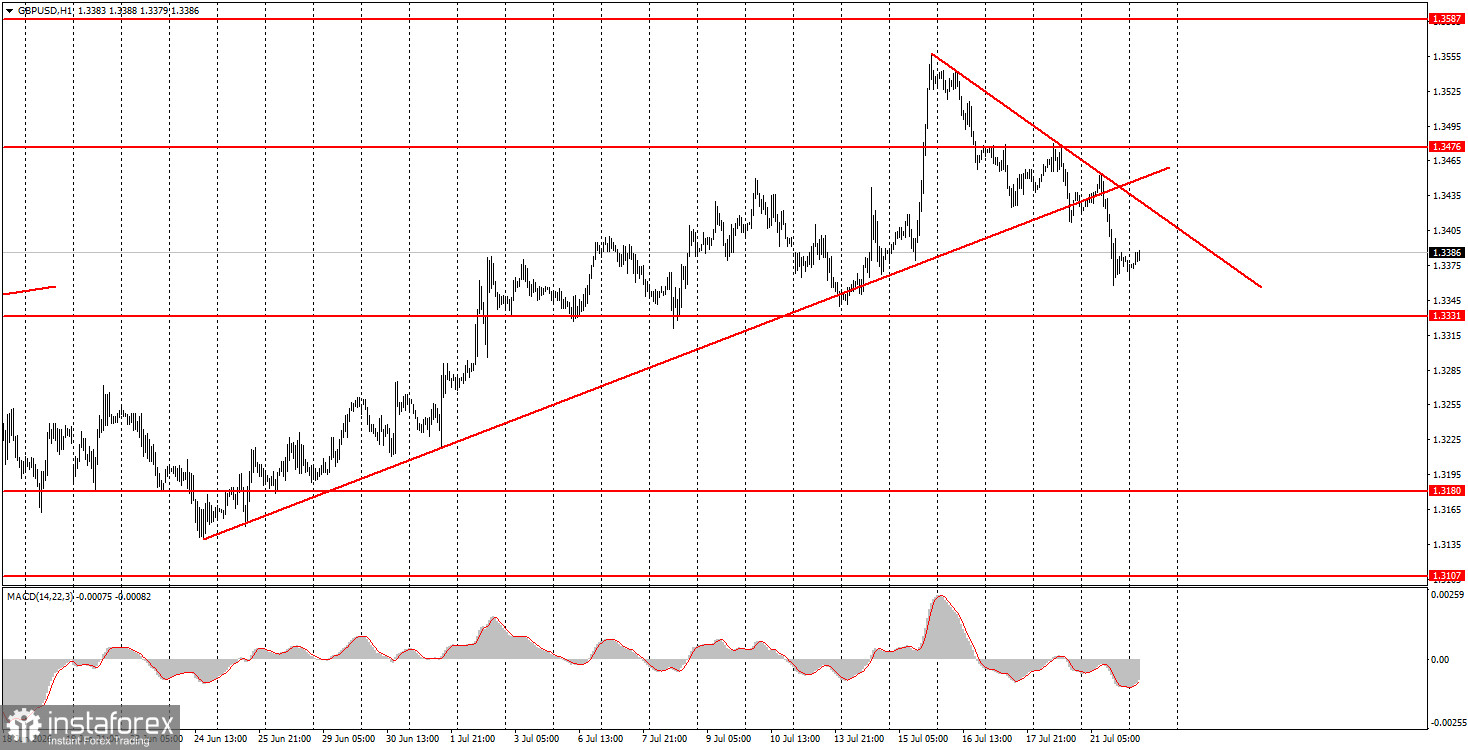
The GBP/USD pair continued its downward trend on Tuesday, developing into a full-fledged trend. The ascending trend line has been broken, and a new descending trend line has been formed. Thus, the British pound may continue to decline in the near future due to technical factors. Yesterday, fairly decent reports on unemployment and wages were released in the UK; however, the market paid no attention to them, and the British currency was predominantly in decline throughout the day. Today, an inflation report will be released in the UK, which the market may have either already factored in or could ignore. In any case, a slowdown in inflation is expected, which will reduce the pound's appeal in the eyes of traders. The Bank of England will certainly not tighten monetary policy with a declining consumer price index. As for geopolitics, it remains completely uncertain. Due to this uncertainty, the market cannot predict energy prices, inflation, or future actions of central banks.
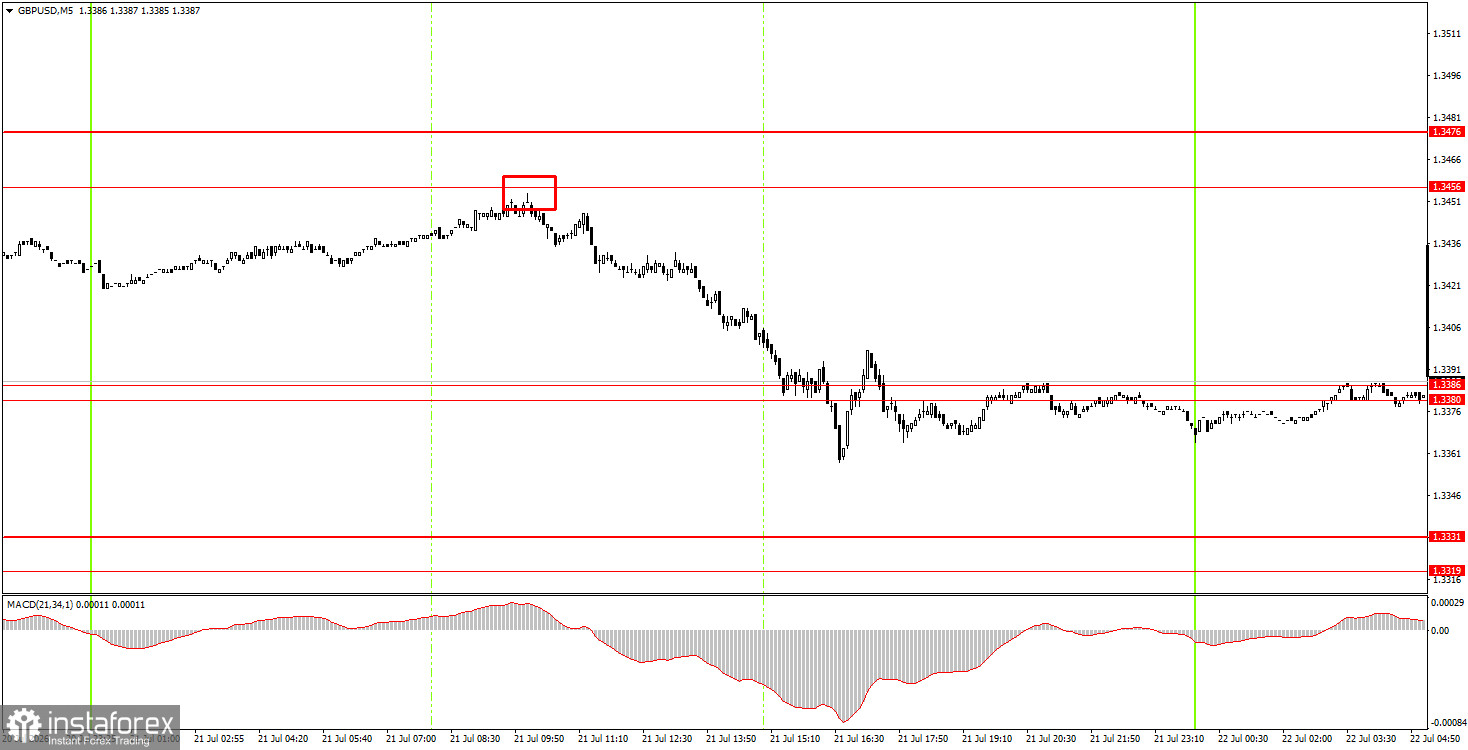
On the 5-minute timeframe on Tuesday, one strong sell signal was formed. During the European trading session, the price precisely tested 1.3456, bounced off it, and by the end of the day, worked through 1.3380-1.3386. Thus, novice traders could open short positions that yielded a profit of 50-60 pips.
On the hourly timeframe, the GBP/USD pair has begun a new downward trend. After three weeks of growth, a correction was necessary. It is difficult to say how long the British pound will continue to fall, but traders currently have a good reference point in the trend line. Thus, until the price consolidates above this line, the downward trend remains.
On Wednesday, novice traders may open new short positions if the price consolidates below the area of 1.3380-1.3386, targeting 1.3319-1.3331. A consolidation above the area of 1.3380-1.3386 will allow for the opening of long positions with targets of 1.3456-1.3476.
On the 5-minute timeframe, the following levels can be traded: 1.3096-1.3107, 1.3175-1.3180, 1.3259-1.3267, 1.3319-1.3331, 1.3380-1.3386, 1.3456-1.3476, 1.3587-1.3598, 1.3631-1.3641, and 1.3695. On Wednesday, the most important report of the week—on inflation—will be published in the UK. However, given the decline of the British currency over the last three days, we believe this report may already be factored in. In any case, it is worth expecting a market reaction to the inflation data, as the BoE's future actions depend on this indicator.
Price levels (areas) of support and resistance are targets when opening long or short positions or sources of signals.
Red lines indicate channels or trend lines that display the current trend and indicate the preferred direction for trading.
The MACD indicator (14,22,3) – histogram and signal line – is a supplementary indicator that can also be used as a source of signals.
Important speeches and reports (contained in the news calendar) can significantly impact the movement of the currency pair. Therefore, during their release, trading should be conducted with maximum caution, or one should exit the market to avoid sharp reversals against preceding movements.
Beginners trading in the forex market should remember that not every trade can be profitable. Developing a clear strategy and practicing money management are key to long-term success in trading.
¡Los informes analíticos de InstaForex lo mantendrá bien informado de las tendencias del mercado! Al ser un cliente de InstaForex, se le proporciona una gran cantidad de servicios gratuitos para una operación eficiente.


