 Zostať

Podmienky obchodovania
Nástroje


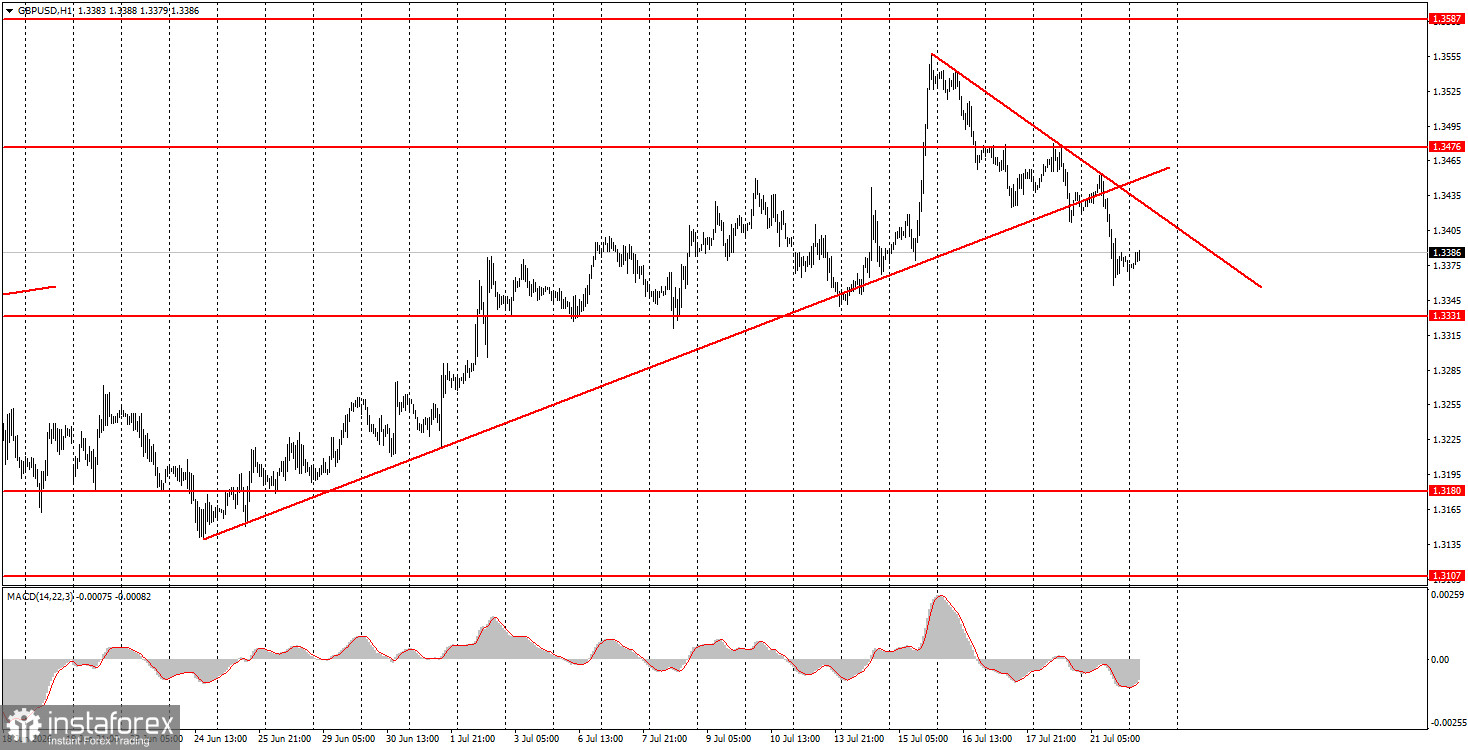
Mena GBP/USD v utorok pokračovala v klesajúcom trende, ktorý sa vyvinul do plnohodnotného trendu. Vzostupná trendová línia bola prelomená a vytvorila sa nová klesajúca trendová línia. Britská libra by teda v blízkej budúcnosti mohla naďalej klesať v dôsledku technických faktorov. Včera boli vo Veľkej Británii zverejnené pomerne priaznivé správy o nezamestnanosti a mzdách; trh im však nevenoval pozornosť a britská mena počas celého dňa prevažne oslabovala. Dnes bude vo Veľkej Británii zverejnená správa o inflácii, ktorú trh buď už zohľadnil, alebo ju môže ignorovať. V každom prípade sa očakáva spomalenie inflácie, čo zníži atraktívnosť libry v očiach obchodníkov. Bank of England určite nebudú sprísňovať menovú politiku pri klesajúcom indexe spotrebiteľských cien. Pokiaľ ide o geopolitickú situáciu, tá zostáva úplne neistá. V dôsledku tejto neistoty trh nedokáže predpovedať ceny energií, infláciu ani budúce kroky centrálnych bánk.
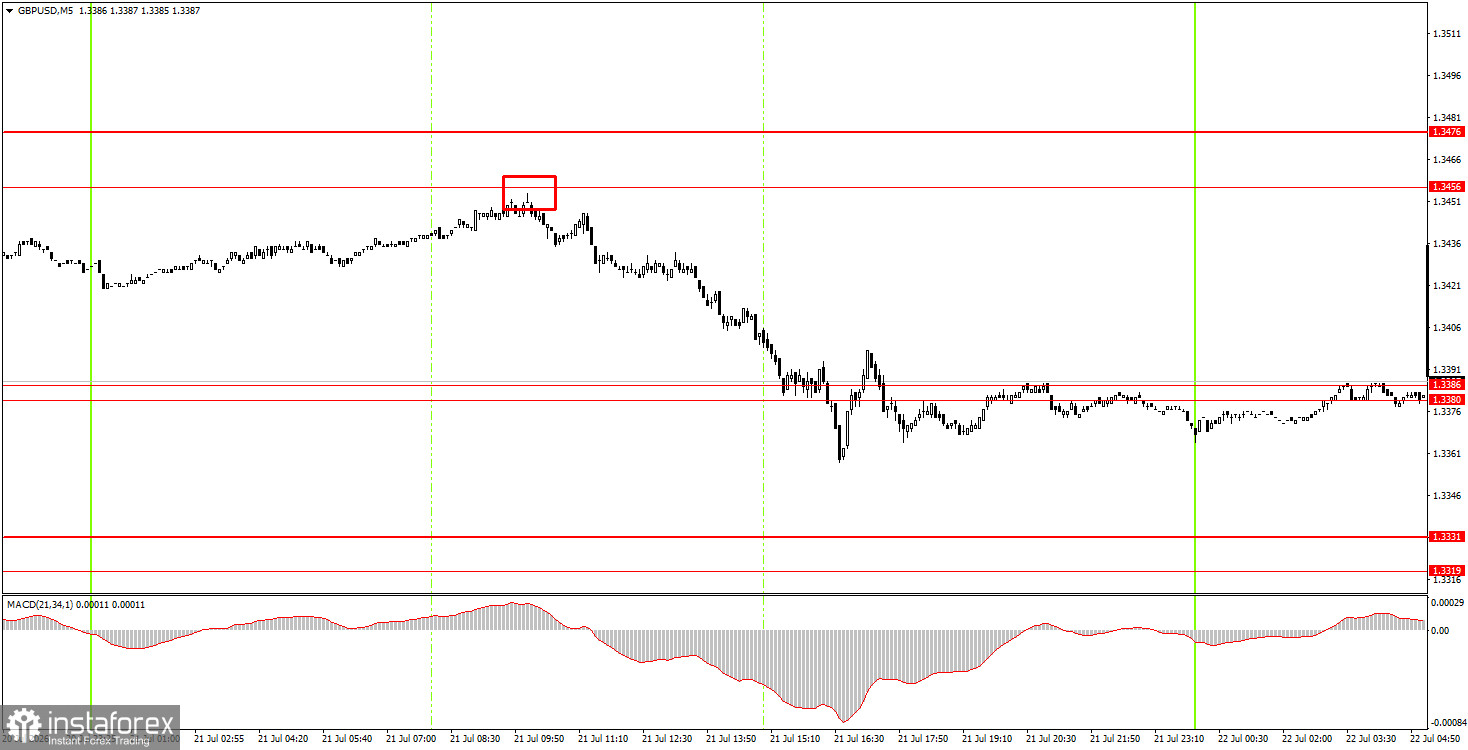
V utorok sa na 5-minútovom grafe vytvoril jeden silný signál na predaj. Počas európskej obchodnej seansy cena presne otestovala úroveň 1,3456, odrazila sa od nej a do konca dňa prešla cez úrovne 1,3380–1,3386. Začiatočníci tak mohli otvoriť krátke pozície, ktoré priniesli zisk 50–60 pipov.
Na hodinovom grafe začal menový pár GBP/USD nový klesajúci trend. Po troch týždňoch rastu bola korekcia nevyhnutná. Ťažko povedať, ako dlho bude britská libra naďalej klesať, ale obchodníci majú v súčasnosti dobrý orientačný bod v podobe trendovej línie. Pokiaľ sa teda cena neustáli nad touto líniou, klesajúci trend bude pretrvávať.
V stredu môžu začínajúci obchodníci otvoriť krátke pozície, ak sa cena ustáli pod oblasťou 1,3380–1,3386 s cieľom na úrovni 1,3319–1,3331. Konsolidácia nad oblasťou 1,3380–1,3386 umožní otvorenie dlhých pozícií s cieľom na úrovni 1,3456–1,3476.
Na 5-minútovom grafe sa v súčasnosti dá obchodovať na úrovniach 1,3096–1,3107, 1,3175–1,3180, 1,3259–1,3267, 1,3319–1,3331, 1,3380–1,3386, 1,3456–1,3476, 1,3587–1,3598, 1,3631–1,3641 a 1,3695. V stredu bude vo Veľkej Británii zverejnená najdôležitejšia správa týždňa – údaje o inflácii. Vzhľadom na pokles britskej meny za posledné tri dni sa však domnievame, že tieto údaje už obchodníci zohľadnili. V každom prípade stojí za to očakávať reakciu trhu na údaje o inflácii, keďže budúce kroky BoE závisia práve od tohto ukazovateľa.
1. Sila signálu závisí od času, ktorý je potrebný na jeho vytvorenie (odraz alebo prelomenie). Čím rýchlejšie sa signál vytvorí, tým bude silnejší.
2. Ak sa na základe falošných signálov otvoria na určitej úrovni dva alebo viac obchodov, následné signály z tejto úrovne by sa mali ignorovať.
3. Na trhu bez jednoznačného trendu môže akýkoľvek menový pár vytvoriť viacero falošných signálov alebo žiadny signál. Technické úrovne možno ignorovať.
4. Obchodné hodiny: obchodné aktivity sa vykonávajú od začiatku európskej seansy do polovice americkej seansy, po ktorej by sa mali všetky otvorené obchody ručne zavrieť.
5. Na hodinovom grafe obchodujte na základe signálov MACD len vtedy, keď je volatilita dostatočná a trend je potvrdený trendovou líniou alebo kanálom.
6. Ak dve úrovne ležia tesne vedľa seba (v rozmedzí 5 až 20 pipov), mali by sa považovať za oblasť podpory alebo rezistencie.
Úrovne podpory a rezistencie slúžia ako cieľové úrovne pri nákupe alebo predaji, alebo ako zdroje signálov.
Červené čiary označujú kanály alebo trendové čiary, ktoré znázorňujú aktuálny trend a naznačujú očakávaný smer obchodovania.
Indikátor MACD (14,22,3) – histogram a signálna čiara – je doplnkový indikátor, ktorý možno tiež využiť ako zdroj signálov.
Dôležité prejavy a správy (obsiahnuté v kalendári správ) môžu výrazne ovplyvniť pohyb menového páru. Počas ich zverejnenia by ste mali zvýšiť opatrnosť alebo opustiť trh, aby ste sa vyhli náhlym cenovým obratom.
Začiatočníci, ktorí obchodujú na devízovom trhu, by si mali uvedomiť, že nie každý obchod môže byť ziskový. Vytvorenie jasnej stratégie a dodržiavanie zásad riadenia kapitálu sú kľúčom k dlhodobému úspechu v obchodovaní.
InstaForex analytical reviews will make you fully aware of market trends! Being an InstaForex client, you are provided with a large number of free services for efficient trading.


