 Rimani
Condizioni di trading
Strumenti


The pair has been moving in a corrective phase around the middle band of Bollinger bands. The nearest support lies at 1.3470, where the 200 SMA is located on the H1 chart. If GBP/USD makes a breakout of the 1.3589 level, then it can go towards the psychological zone of 1.3700. To the downside, a critical level remains in place around 1.3451.
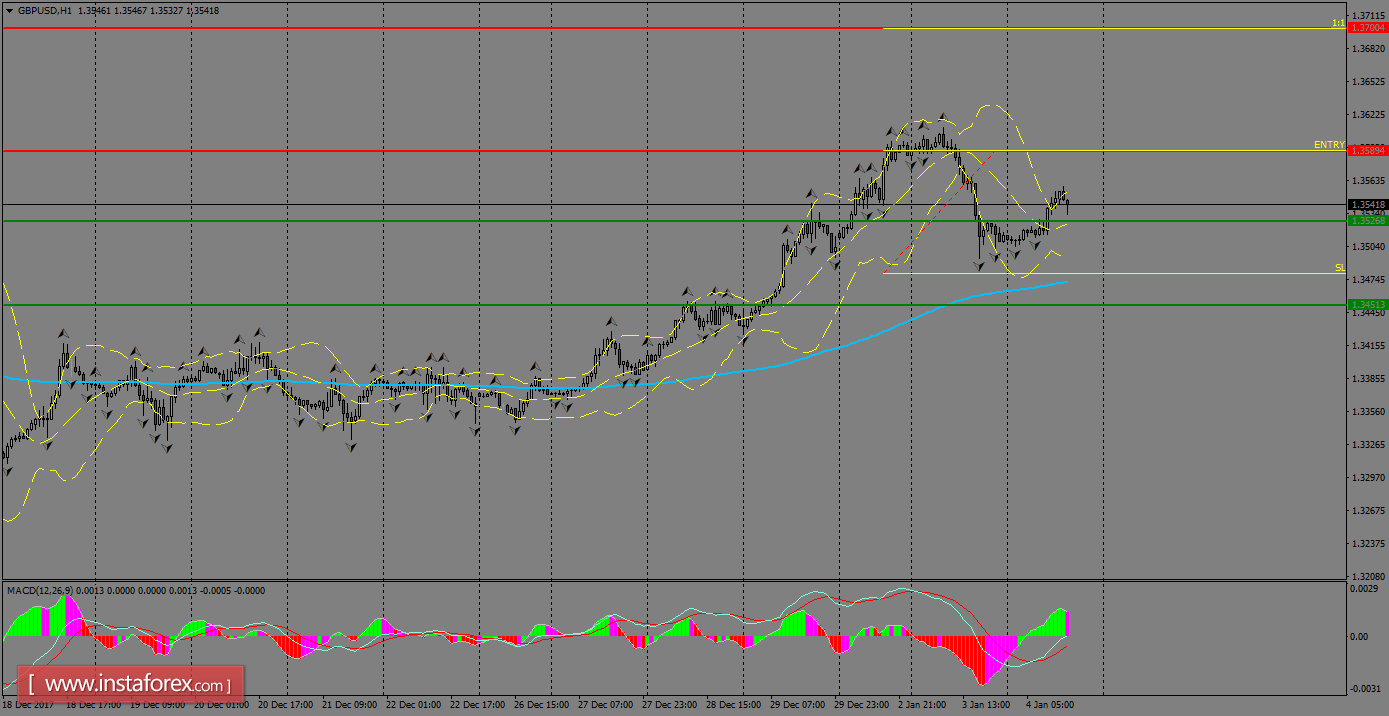
H1 chart's resistance levels: 1.3589 / 1.3700
H1 chart's support levels: 1.3526 / 1.3451
Trading recommendations for today: Based on the H1 chart, buy (long) orders only if the GBP/USD pair breaks a bullish candlestick; the resistance level is at 1.3589, take profit is at 1.3700 and stop loss is at 1.3480.
Le recensioni analitiche di InstaForex ti renderanno pienamente consapevole delle tendenze del mercato! Essendo un cliente InstaForex, ti viene fornito un gran numero di servizi gratuiti per il trading efficiente.


