 Zůstat
Obchodní podmínky
Nástroje

The pair has been moving in a corrective phase around the middle band of Bollinger bands. The nearest support lies at 1.3470, where the 200 SMA is located on the H1 chart. If GBP/USD makes a breakout of the 1.3589 level, then it can go towards the psychological zone of 1.3700. To the downside, a critical level remains in place around 1.3451.
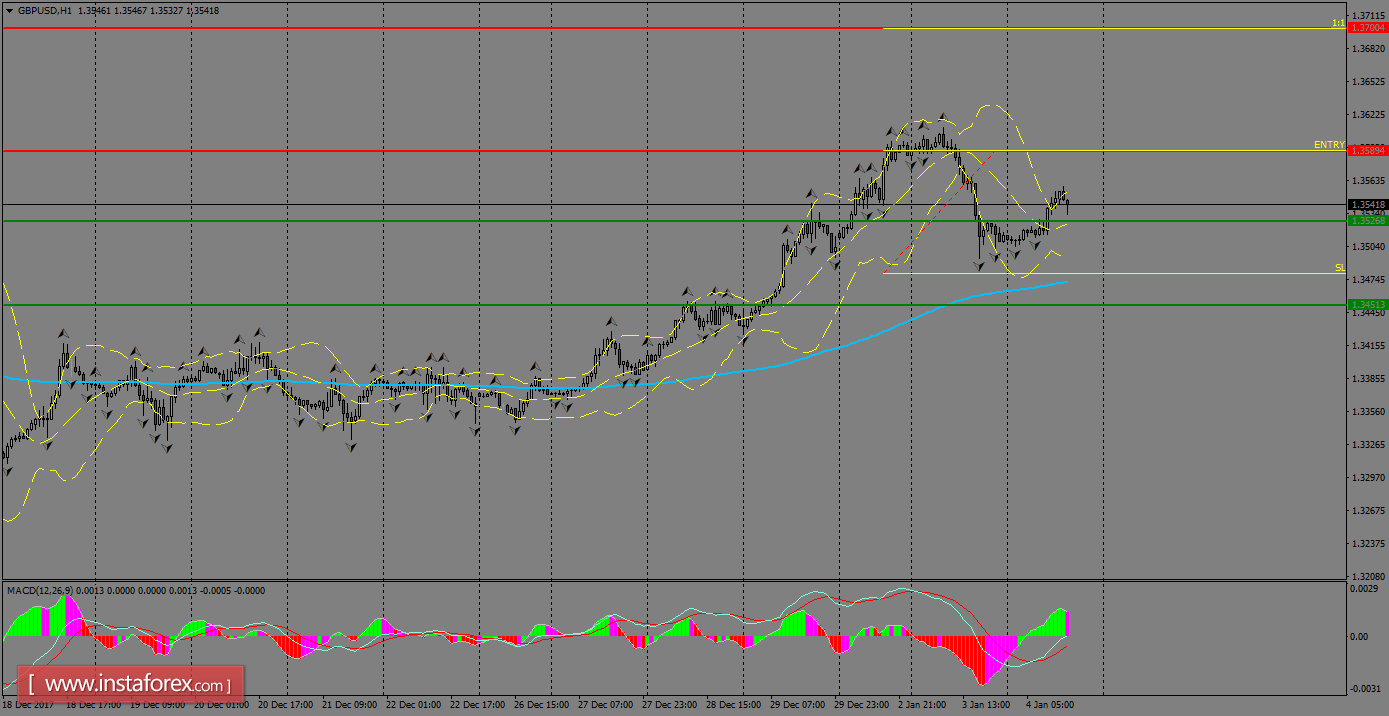
H1 chart's resistance levels: 1.3589 / 1.3700
H1 chart's support levels: 1.3526 / 1.3451
Trading recommendations for today: Based on the H1 chart, buy (long) orders only if the GBP/USD pair breaks a bullish candlestick; the resistance level is at 1.3589, take profit is at 1.3700 and stop loss is at 1.3480.
Díky analytickým přehledům společnosti InstaForex získáte plné povědomi o tržních trendech! Jako zákazníkovi společnosti InstaForex je Vám k dispozici velký počet bezplatných služeb umožňujících efektivní obchodování.


